Introduzione
Il tutorial è basato su un progetto QGIS dedicato alla gestione di un layer rappresentante una serie di edifici dislocati sul territorio.
Oltre agli aspetti geografici il progetto prevede la gestione di numerosi e diverisficati attributi e di eventauli interventi di manutezione tramite una relazione di tipo 1:n
Tramite questo tutorial sarà possibile:
personalizzare i vari aspetti grafici-funzionali del progetto demo
pubblicare il progetto come servizio WebGis
creare ricerche personalizzate
add plots made with DataPlotly QGIS plugin
attivare la funzionalità di editing personalizzando form e widget associati
Download demo data
The tutorial is based on predefined data and QGIS 3.22.x LTR project downloadable from this link.
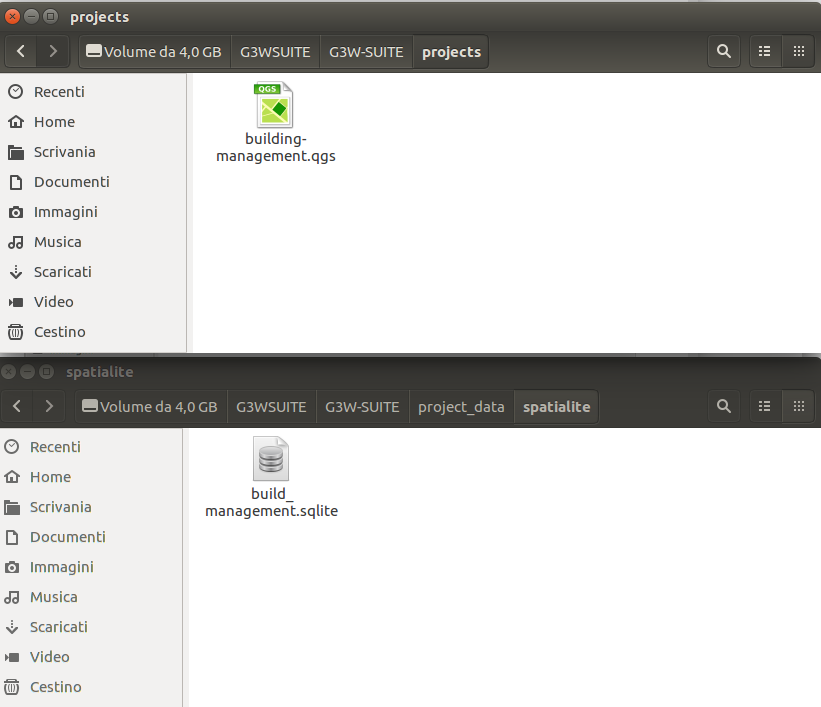
The .zip file contains the G3W-SUITE directory with three sub directories:
projects: containing a QGIS project (buildings_management.qgs) already optimized for the tutorialproject_data/spatialite: containing a SpatiaLite DB with basic data (build_management_demo.sqlite)plots: containing a a series of plots created with the DataPlotly plugin and saved in xml format
Inside the build_management_demo.sqlite SpatiaLite DB there are the following layers:
buildings(layer poligonale): layer di riferimento per gli aspetti di editingmaintenance_works(tabella alfanumerica): con gli interventi di manutenzioni associati ai singoli edificibuildings_rating(alphanumeric table): with the annual assessments relating to individual buildingsroads(linear layer): layer to define the address associated to any buildingswork_areas(layer poligonale): con la perimetrazione di aree di lavoro da utilizzare per definire eventuali geo-constraintstype_subtype(alphanumeric table): a decoding table of the type and subtype values associated with the individual buildings
IMPORTANTE: per il corretto funzionamento della demo, una copia dei dati geografici è presente sul server. La modifica dei dati potrebbe ripercuotersi sulla pubblicazione del progetto
The project (based on QGIS LTR 3.22.x) foresees:
una vestizione categorizzata dal
layer buildingsbasata sul campo categoricotypethe presence of a 1: n relationship between the
buildingslayer and the alphanumericmaintenance_worksandbuildings_ratingtablesquery form prestutturati per il layer
buildingse la tabellamaintenance_workspredefined editing widgets for the fields of the two main layers:
buildings,maintenance_worksandbuildings_ratingtablestwo standard print layout in A4 and A3 and an two atlas print layout based on buildgs layer features
Modificare il titolo del progetto QGIS
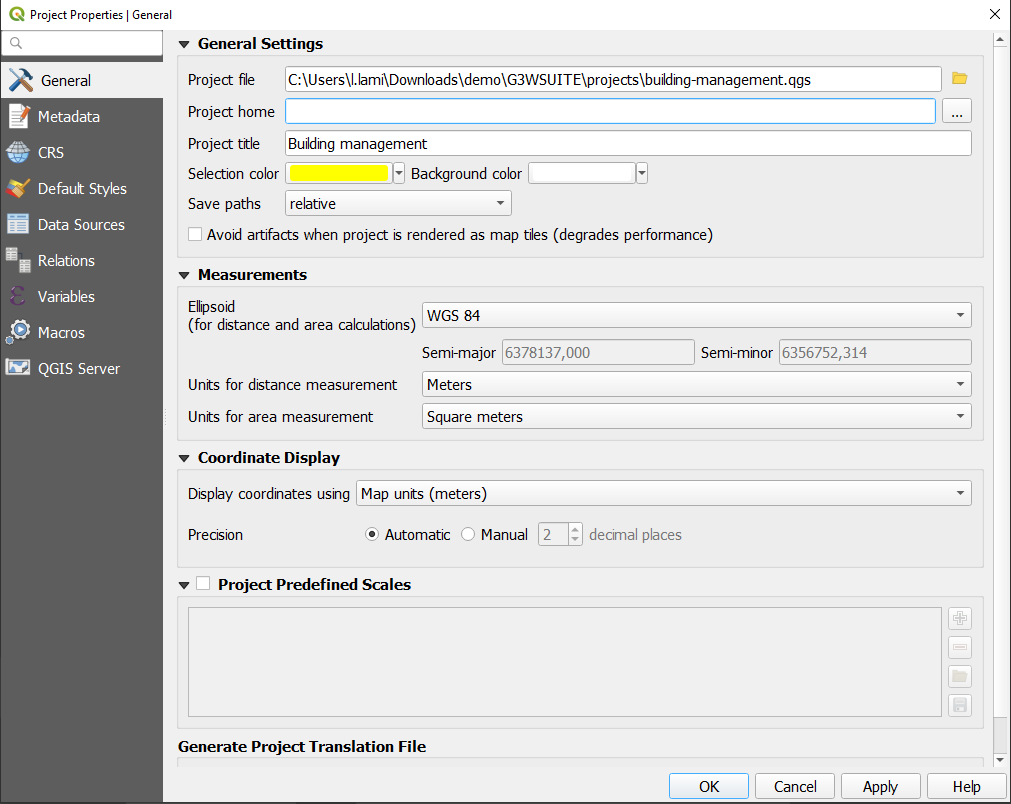
Il sistema di pubblicazione prevede l”utilizzo del titolo del progetto come identificatore univoco del servizio WebGis
*Per questo, prima di pubblicare i progetto sarà quindi necessario modificare il titolo associato al progetto base (Progetto -> Proprietà... - Sessione: Generale)
Accedere al servizio on line
To publish the project, you can access the G3W-SUITE test application via the following URL: https://v33.g3wsuite.it
Per accedere al Pannello di Amministrazione è necesario loggarsi tramite le seguenti credenziali:
user:
demopassword:
G3wsuite!
In case of login fails, report the problem to info@gis3w.it
Pubblicare il progetto QGIS come servizio WebGis
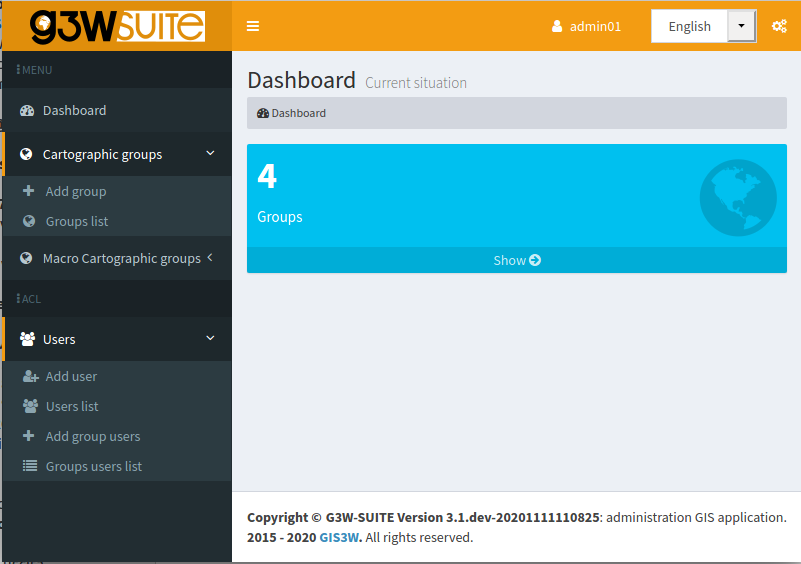
In seguito ad autenticazione sarà possibile accedere alla Sessione di Amministrazione e visualizzare la Dashboard.
Nella Dashboard sarà presente il menù per l”accesso ai Gruppi Cartografici di competenza del vostro utente e i menù relativi ad ulteriori moduli non attivi in questa demo.
Clicca sulla voce Mostra nella casella celeste Gruppi per accedere all”elenco dei Gruppi Cartografici disponibili.
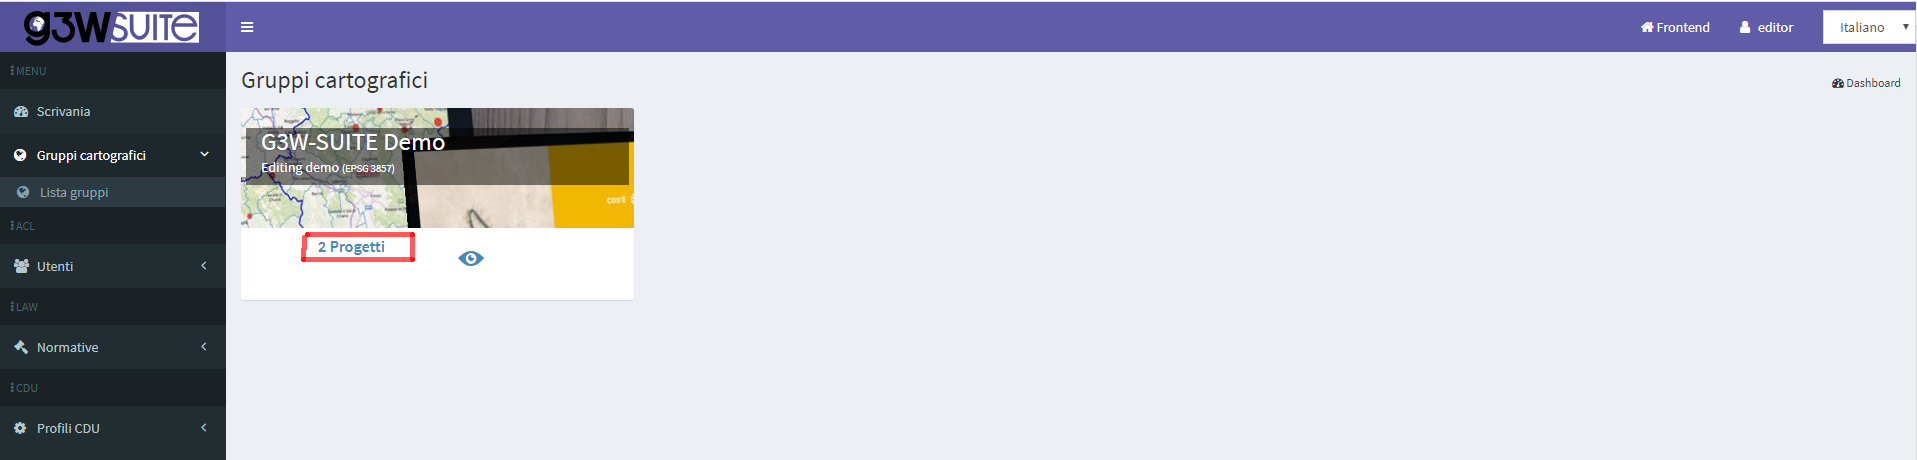
Accedi all”elenco dei webgis presenti nel Gruppo Cartografico G3W-SUITE Demo facendo click sul numero di progetto riportato.
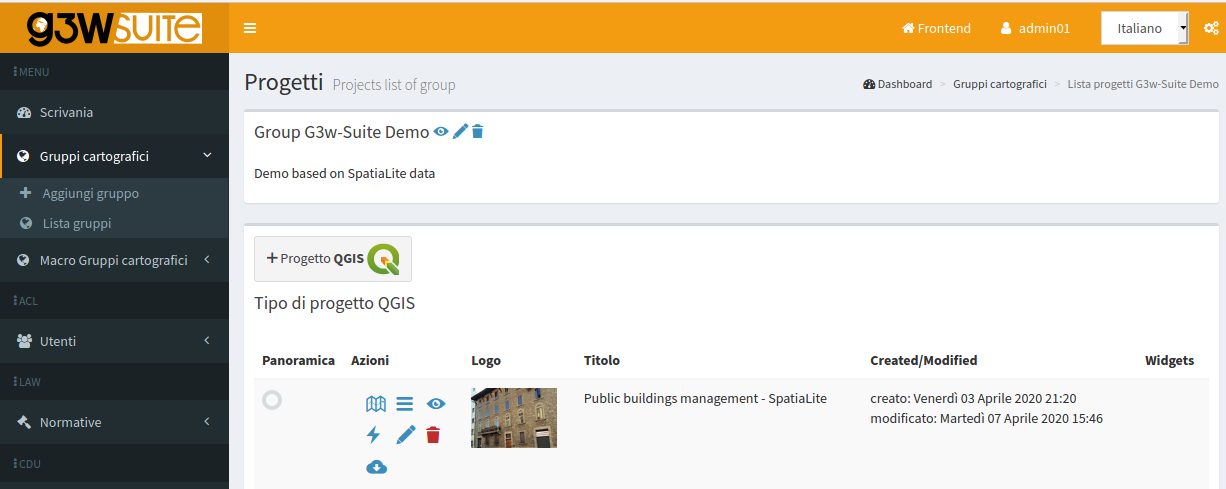
Ora clicca sul pulsante  per pubblicare il tuo progetto QGIS.
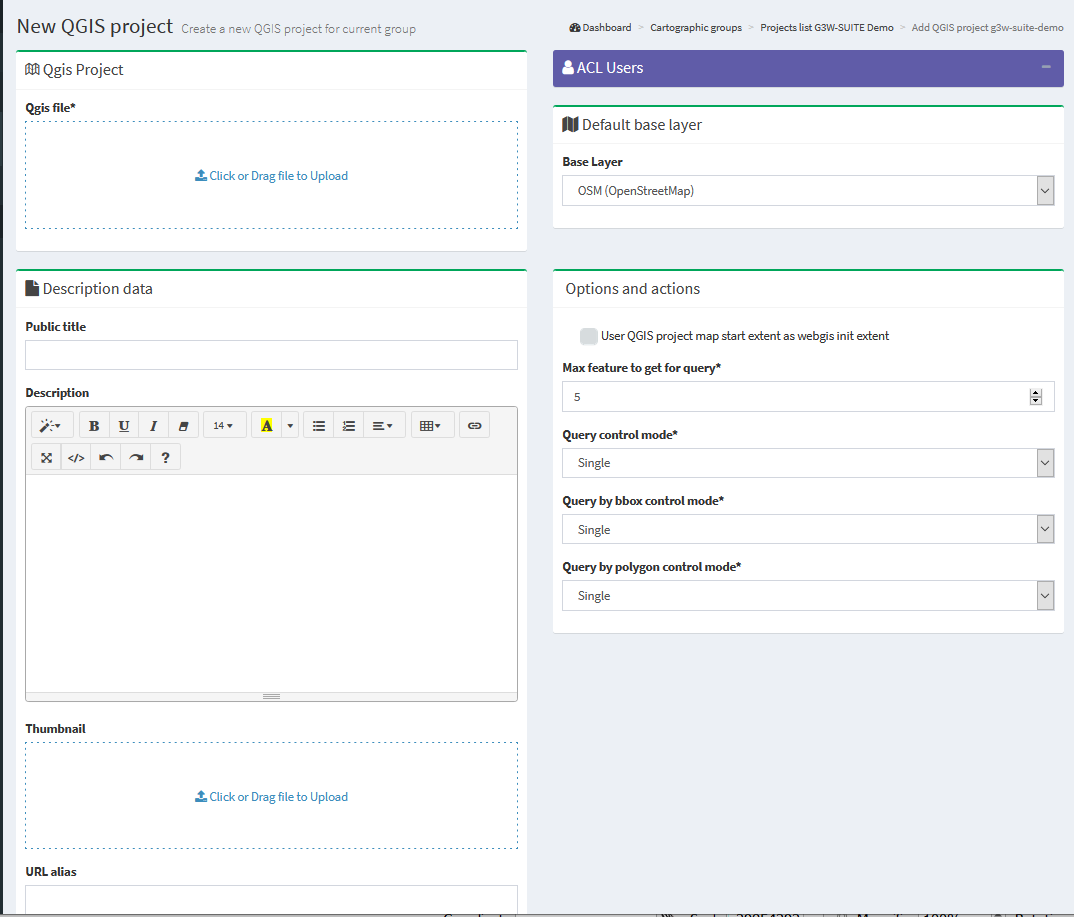
Compilate il form definendo i vari aspetti da associare al servizio WebGis in pubblicazione:
Progetto QGIS
File QGIS*: caricare il progetto cartografico di QGIS da pubblicare (file .qgz o .qgs)
ACL Users
Gestione poteri di accesso e gestione
Utenti Viewers: si definiscono i singoli utenti (Viewers) che hanno le credenziali per visualizzare il servizio WebGis. Scegliendo l”utente anonimo (AnonymusUser) il gruppo sarà ad accesso liberoGruppi di utenti Viewer: si definiscono i gruppi di utenti (Viewer) he hanno le credenziali per visualizzare il contenuto del servizio.
BaseLayer
In questa sessione si va a definire quale base layer deve essere attivo all”avvio.
La scelta è limitata alla lista degli strati di base attivati per il gruppo cartografico nel quale si lavora.
E” possibile anche non definire nessun strato di base attivo all”avvio.
Descrizione
Titolo pubblico: Titolo da associare al progetto e visualizzato sull”header del client.Se lasciato vuoto verrà utilizzato il titolo associato al progetto QGIS o, in mancanza di questo, il nome del file di progettoDescrizione: descrizione libera del progetto che apparirà a livello del portale pubblico.Thumbnail (Logo): logo da associare al progetto. Tale immagine sarà visibile in associazione con il progettoURL alias: E” possibile impostare un alias per la parte finale dell”URL della mappa.
ATTENZIONE: contenuti segnati con asetrisco sono obbligatori
Options and actions
Choose your preferred options regarding the following options:
User QGIS project map start extent as webgis init extent:check this control if you want set initial extent from QGSI project initial extent, Project properties -> QGIS Server -> WMS capabilities (Advertised extent)Tab's TOC active as default:set tab’s TOC (Layers, Base layers, Legend) open by default on startup of webgis serviceLegend position rendering:this option allows to set legend rendering position:In a separate TAB: default value, the legend is rendered into a separate tab
Into TOC layers: the legend is rendered inside layers toc
Automatic zoom to query result features:if in the results of a search there are only features of a layer, the webgis automatic zoom on their extension
Compilati i campi di interesse si clicca sul tasto Salva per confermere la pubblicazione
Se la pubblicazione è andata a buon fine il progetto QGIS apparirà nell”elelnco dei progetti presenti nel Gruppo Cartografico
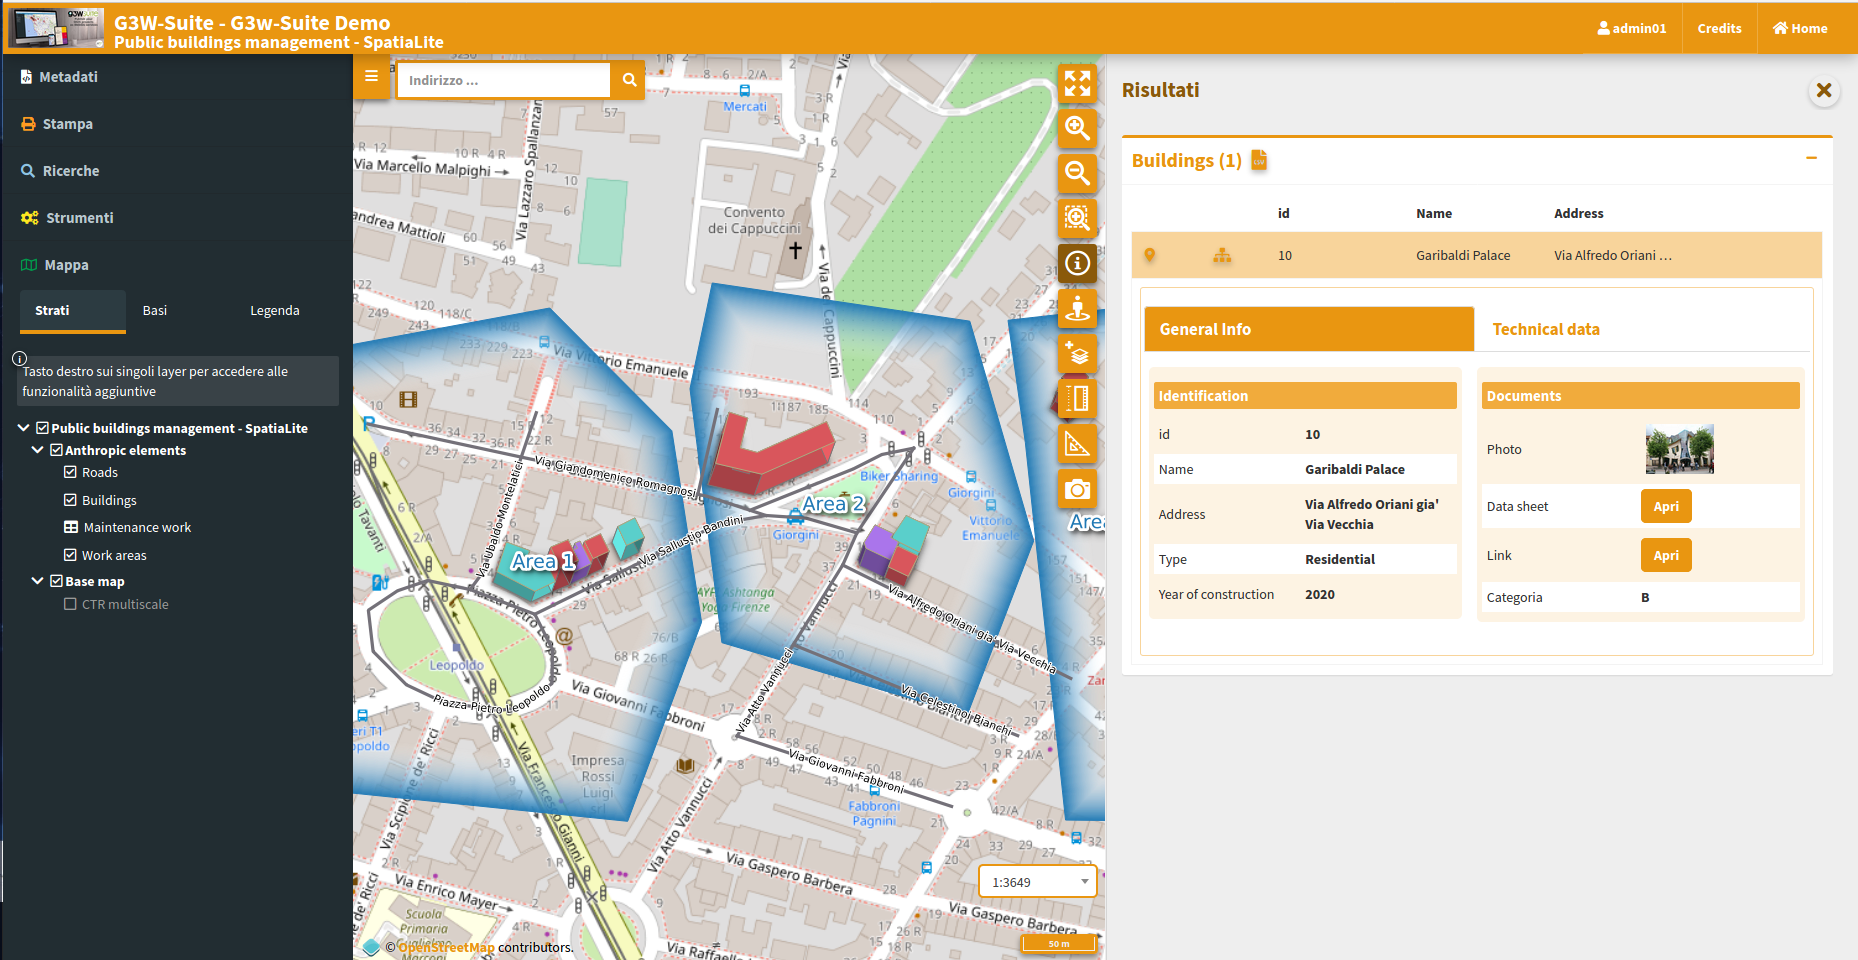
Cliccando sull”icona Visualizza mappa si accederà al servizo WebGis in consultazione.
Aggionare il servizo WebGis pubblicato
Se volete modificare alcuni aspetti grafico-funzionali del vostro servizio WebGis, modificate il vostro progetto QGIS e aggiornate il servizio WebGis cliccando sull”icona Modifica 
Nel form visualizzato ricaricate il progetto QGIS con le vostre modifiche e cliccate sul tasto Salva
Attivazione funzioni aggiuntive
Una volta che il tuo progetto è stato pubblicato, puoi accedere all”elenco dei widget e funzioni aggiuntive per arricchire il tuo servizio WebGis.
Gestione widget
Per accedere alla gestione delle funzioni aggiuntive cliccate sull”icona Lista Layers  a livello del vostro progetto QGIS
La nuova sessione mostrerà la lista dei layer presenti nel progetto QGIS pubblicato
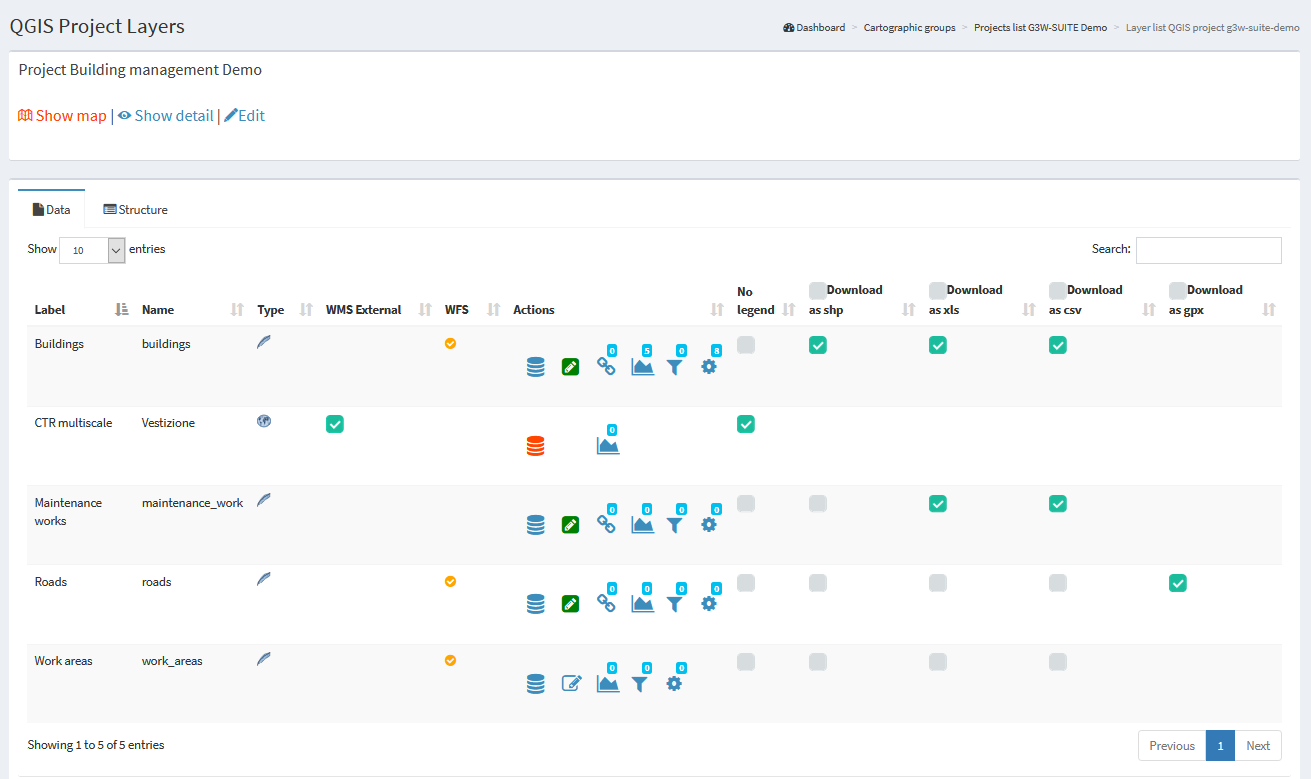
Etichetta: alias del layer applicata a livello di progetto QGIS
The eye icon allows you to know the ID associated with the layer at the project level, this ID will be useful for creating parameterized URLs
Name: name of the layer (file or DB table)
 Type: illustra il tipo di dato (WMS, PostGis, SpatiaLite, GDAL/OGR…)
WMS esterno: per accelerare il caricamento, i layer WMS presenti in un progetto QGISsono gestiti direttamente da Django e non da QGIS-Server. Tuttavia,questo metodo impedisce l”applicazione di qualsiasi stile (ad es. livello di opacità)definito a livello di progetto. La scelta dell”opzione WMS esternasignifica che il layer WMS è gestito direttamente da QGIS-Server e quindipuò essere applicato lo stile associato.
WFS: una spunta mostra se il layer è pubblicato o meno come servizio WFS
Actions: a series of icons dedicated to various functions
 Cache del layer: ti permette di attivare e gestire la cache del layer
 Editing layer: mostra se la funzione di modifica online è attiva sul layer e ti permette di attivarlo e definirlo
 Hide layer by user/groups: hide specific layers from the TOC based on specific users or groups of users
 QPlotly widget: add or manage plots created with DataPlotly QGIS plugin
 Geo-constraints by user/group: create or manage editing and visualization geo-constraints based on poligonal layers
 Alphanumeric and QGIS expressions constraints by user/groups: create or manage editing and visualization constraints based on SLQ language or QGIS expressions
 Hide columns by User/Groups: create or manage constraints on one or more fields of a layer based on single or group user/s
 Widgets list: shows how many widgets (eg searches) are associated with this layer and allows you to activate new ones
 Manage layer styles: manage multi-style layer
Not show attributes table: hide attributes table of the layer for every users
No legend: consente di definire se il layer deve o meno essere presente nella legendadel client Web
Download: allows the download of the geographic and not geographic layers in various formats
Download as shp/geotiff: for vector and raster layers
Download as GPK: for geographic or not geographic layers
Download as xls: for all types of layers, in .xls format
Download as csv: for all types of layers, in .csv format
Download as gpx: for geographic layers, in .gpx format
The number above each Action icon shows if and how many related objects are present.
Prova ad attivare le opzioni disponibili e verificare il risultato refreshando il servizio WebGis
Creazione strumenti di ricerca
Per creare uno strumento di ricerca disponibile a livello WebGis, selezionare il layer vettoriale su cui basarsi per creare lo strumento e fare clic sull”icona Elenco widget ![]()
NB: there may be a number of searches created by other users for the same layer.
E” possibile attivarle cliccnado sul check Collegato
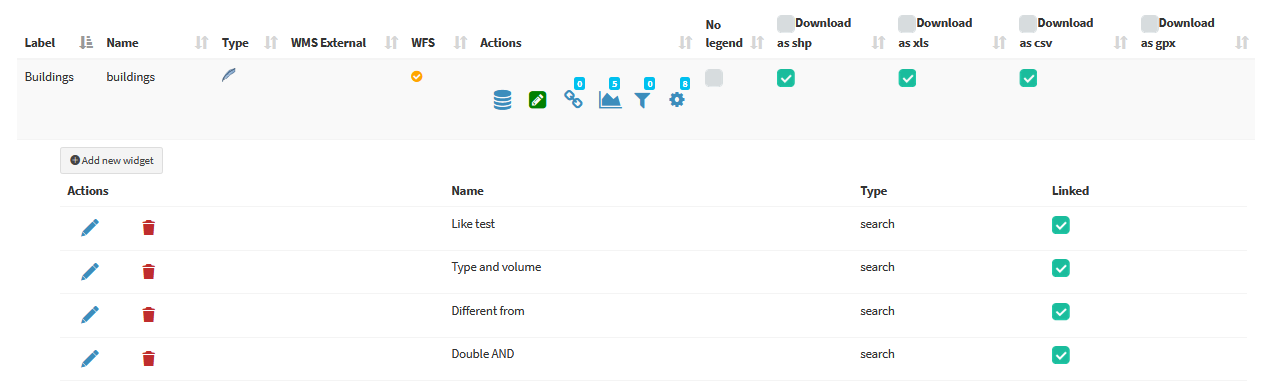
Le ricerche elencate possono essere modificate, cancellate o scollegate usando lerelative icone.
Per creare una nuova ricerca, fai clic sul link blu Nuovo widget
Nel form è possibile definire:
Titolo del form
Type: «Search»Nome: nome che utilizzerà G3W-SUITE per registrare internamente il widget di ricerca.
Configurazione generale delle ricerca e risultati
Titolo ricerca: titolo che identifica la ricerca che diverrà disponibile nel pannello Ricerche dell”interfaccia WebGis
Impostazioni campi di ricerca
Campo: campo su cui realizzare la ricercaWidget: method of entering the value to be searchedInputBox: manual compilationSelectBox: values shown via drop-down menuAutoCompleteBox: values shown through auto-complete modeAlias: alias assegnato al campo che comparirà nel form di ricercaDescrizione: descrizione assegnata al campoOperatore comparizione: operatore di comparazione (=, <, >, ><, >=, <=, LIKE, ILIKE) tramite qui verrà realizzata la query di ricerca. Gli operatori LIKE e ILIKE saranno disponibili solo per layer PostGis o SpatiaLiteDipendenza: questo parametro (facoltativo) permette, solo nel caso di widget SelectBox, di elencare la lista dei valori di un campo filtrati in base al valore definito per i campi precedenti. Lo strumento permette, ad esempio, di mostrate, nel menù a tendina dedicato alla scelta delle particelle catstali, solo le particelle collegate al foglio scelto nell’opzione precedente. Tale funzione è disponibile solo per layer PostGis o SpatiaLite.
Now it is possible to define the dependence more or less strong (strictly).
In case of strictly dependence, the values of the dependent fields will be loaded only after the choice of the value of the field on which the dependency depends.
Otherwise it will be possible to define the values of the individual fields freely and without a specific order. The values available for the other fields will in any case depend on the choice made.
The button  allows you to add additional fields for the construction of the search query currently manageable through AND/OR operators.
The example below shows the compilation of the form for creating a search widget dedicated to a cadastral cartography layer.
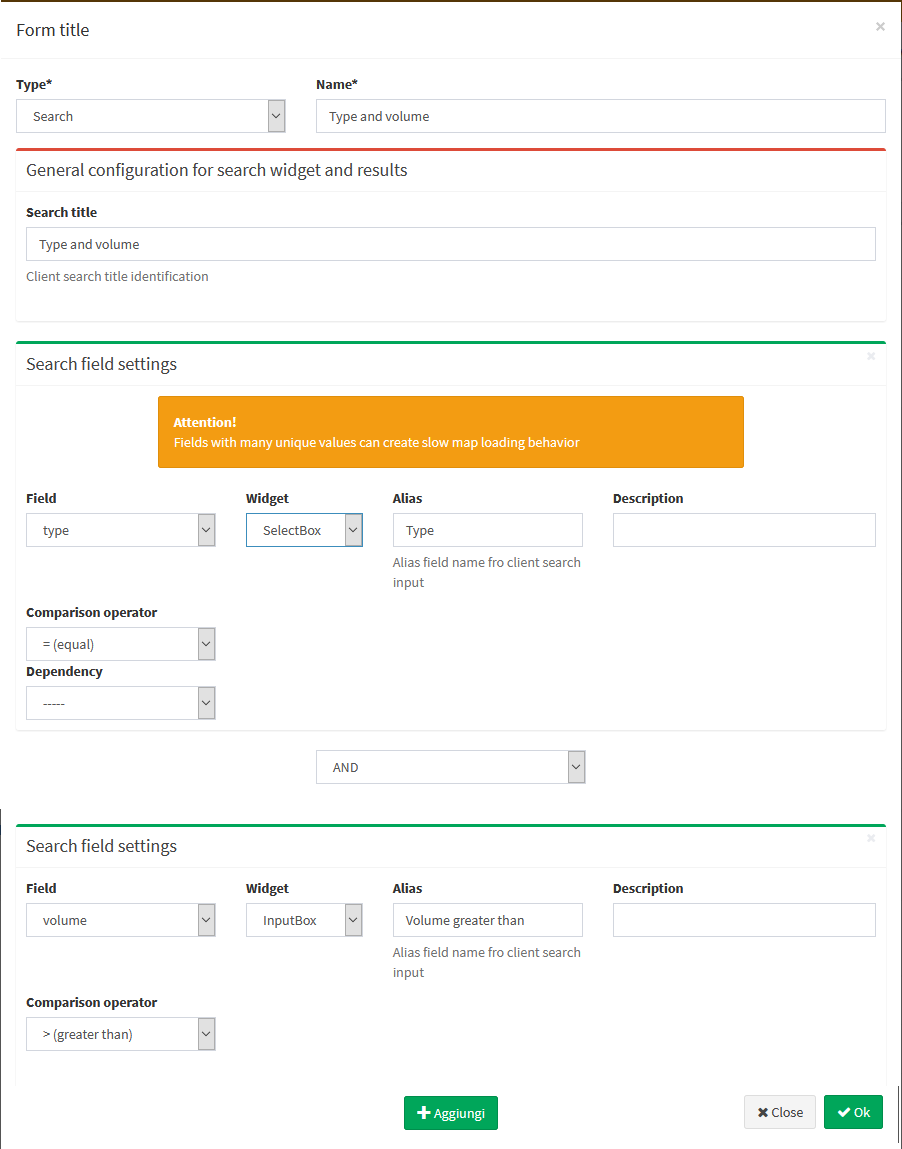
Una volta compilato il form si clicca sul tasto OK per salvare le impostazioni.
Salvate le impostazioni il widget realizzato comparirà nella lista dei Widget associati al layer.
Il widget risulterà già Collegato e quindi disponibile nell”inerfaccia WebGis.
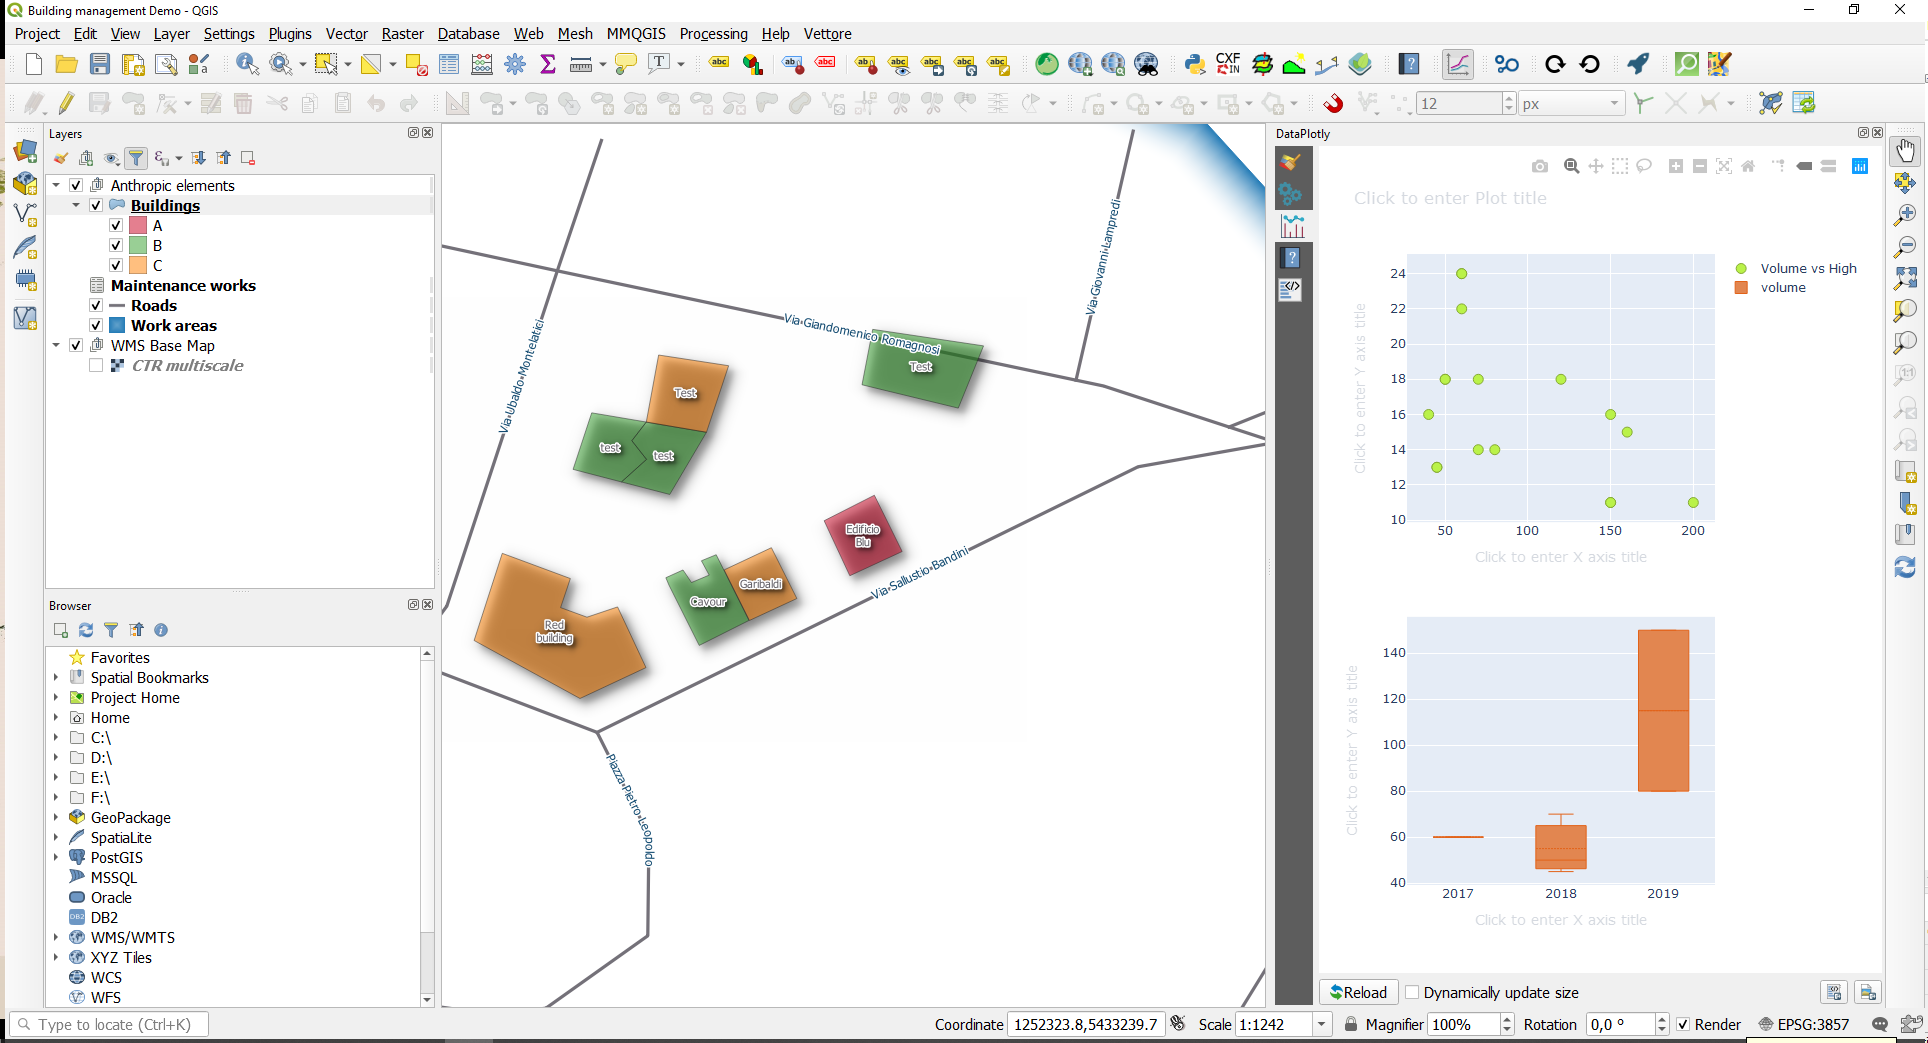
Plots widget
Add plots created using QGIS DataPlotly (a great plugin developed by Matteo Ghetta) in the cartographic client.
The module, based on the Plotly library, manages plots saved as xml.
The plots are connected to the layers defined on the QGIS project, in this way, as for the searches and the constraints, it is possible to activate the same plots on all WebGis services in which the reference layer is present.
For this reason, there may be some plots created by other users for the same layer.
You can activate them by clicking on the Linked chekbox.
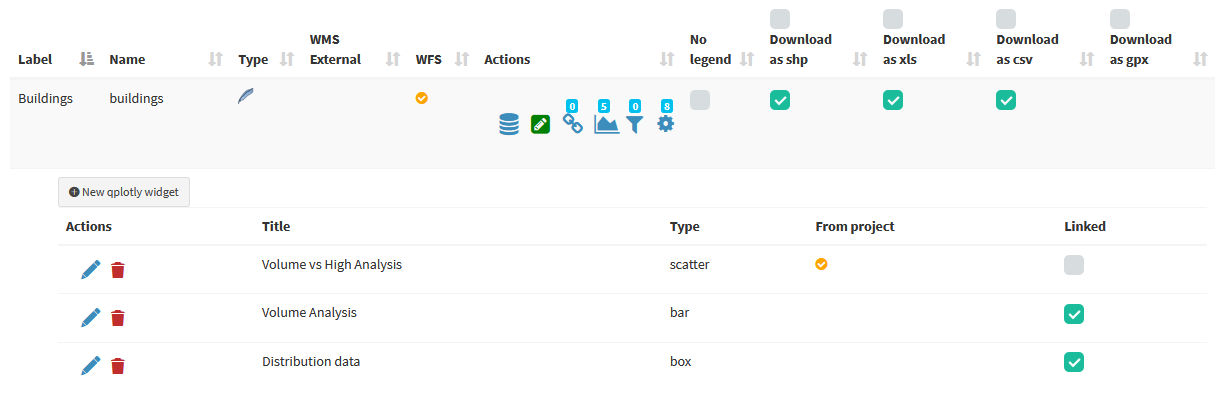
The title of the chart, defined at the plugin level, will be the unique identifier.
Try to create your plots in the QGIS project, save them as .xml and upload them to view the resluts on the webgis.
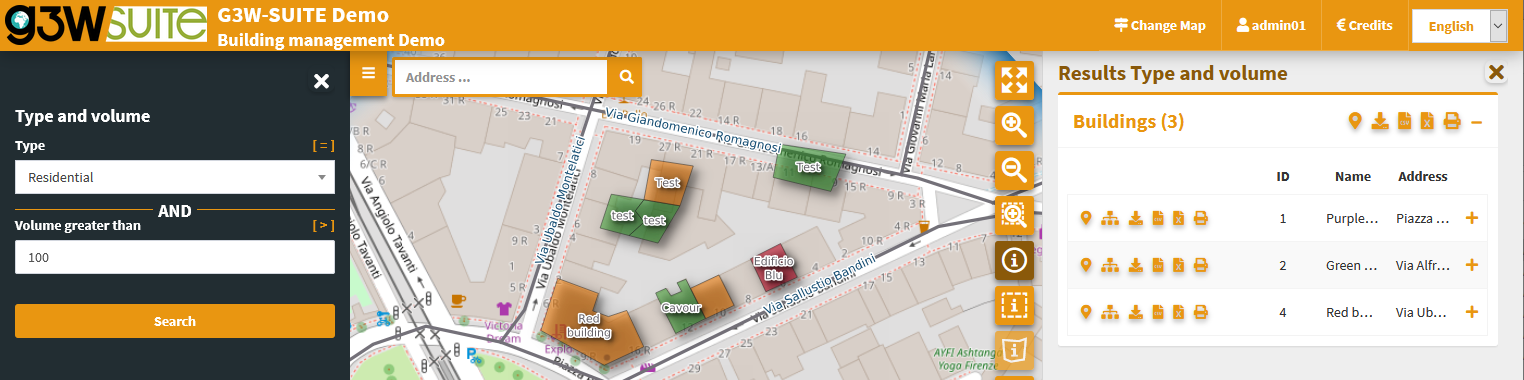
The graphs are filterable based on the:
 features visible on the map
 filter based on the selected features
These filters are also reflected on the plots associated to the related data (in 1:N mode) based on the visible and/or selected parent features.
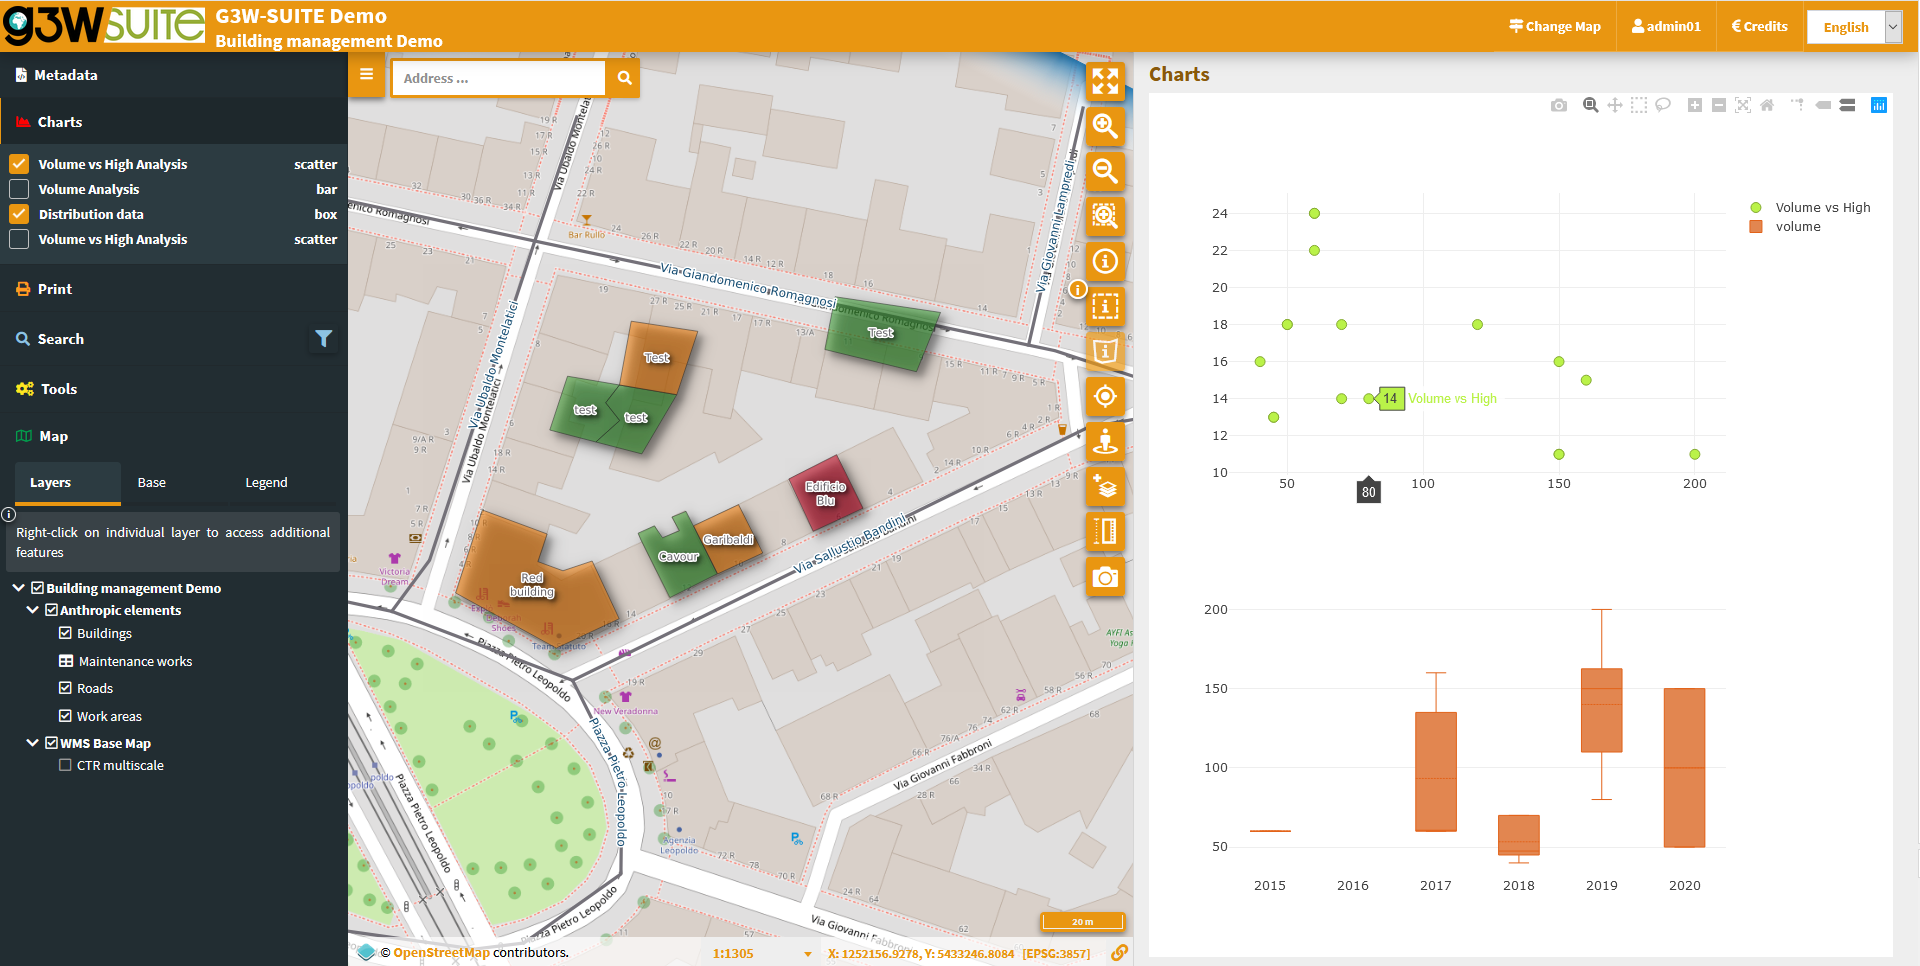
The filter based on the map content can be activated globally on all plots (icon at the top of the panel dedicated to charts) or on only some specific plots (icon placed at the level of the individual plots).
The plots will automatically update after pan and zoom operations on the map
If activated, the filter based on the selected features is automatically activated on all related plots (associated with the same layer and with the 1:N relationed tables)
Appropriate messages at the single plots level will indicate the activation of these filters.
If 1: N relationships are associated with the interrogated layer and plots have been activated on the referencing tables, it will also be possible to consult these plots by querying the referenced layer and clicking on the Show relation charts icon present in the results form.

Show relation charts: display of graphs related to 1: N related data. Only if 1: N relationships are associated with the interrogated layer and graphics have been activated on the boy tables.
Editing on line
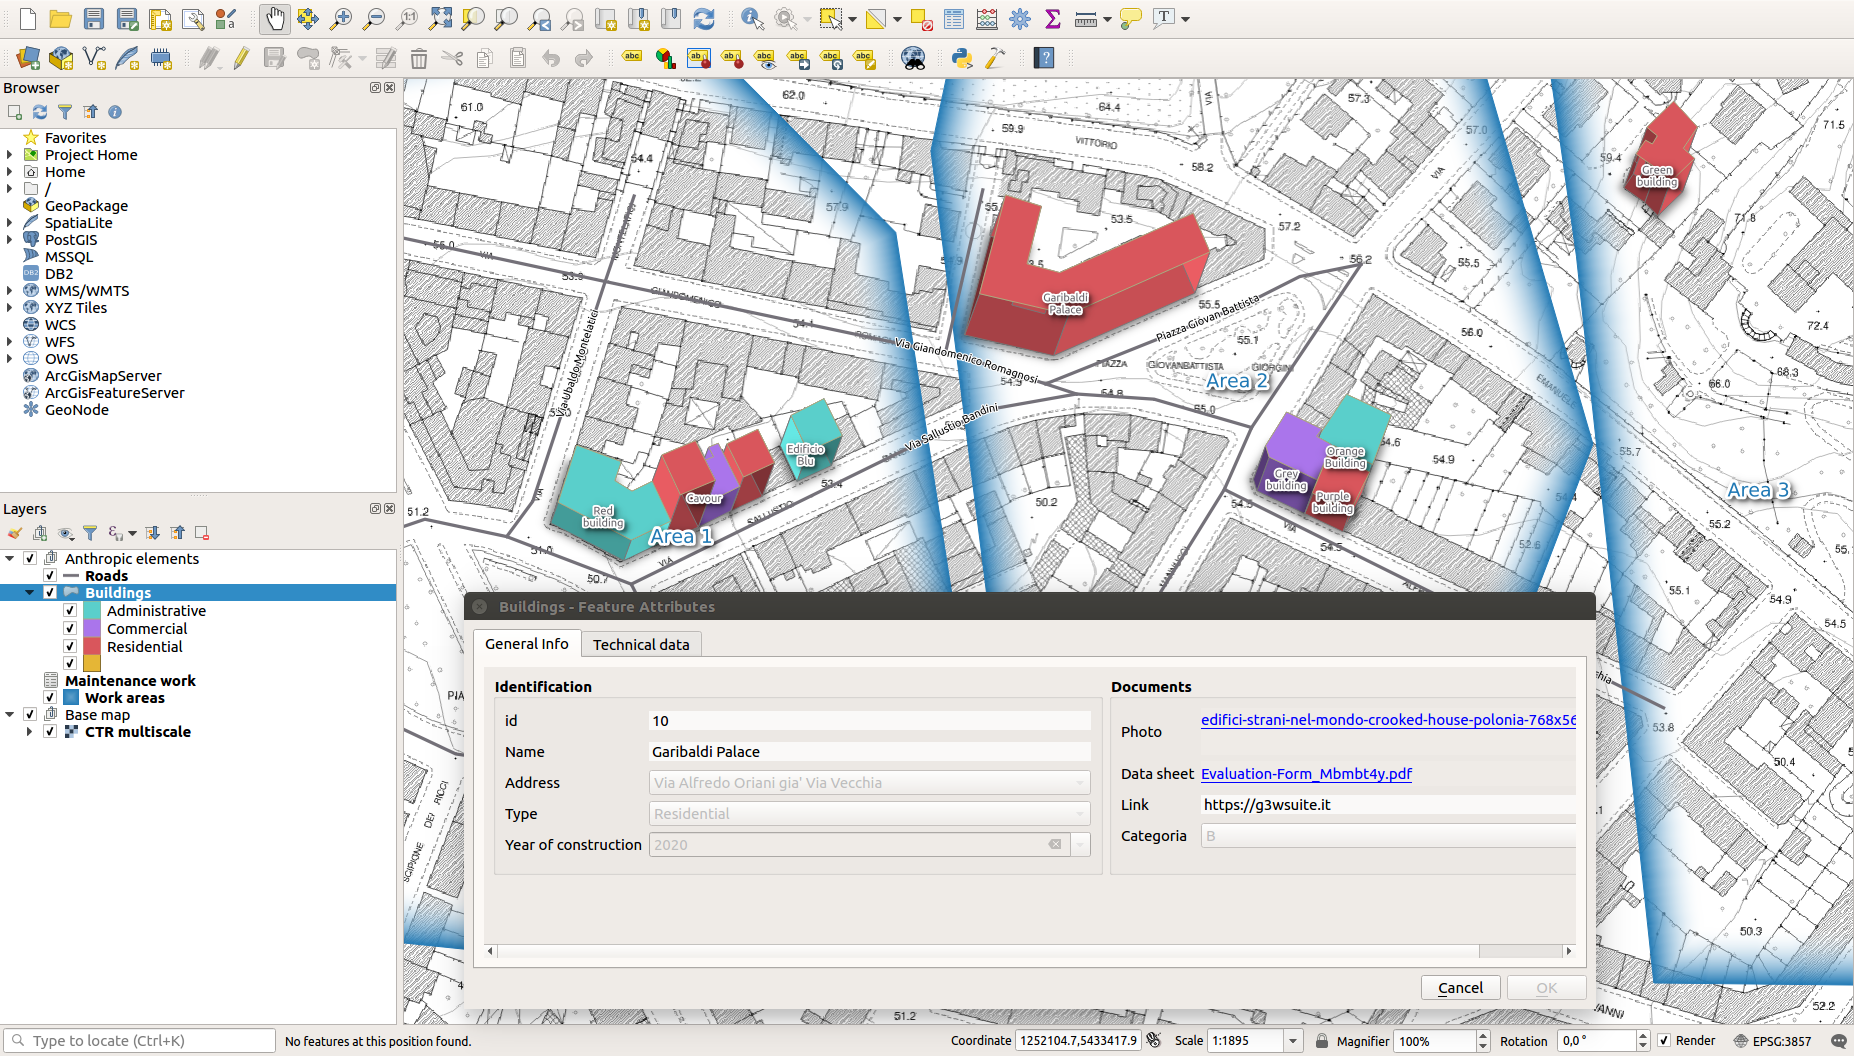
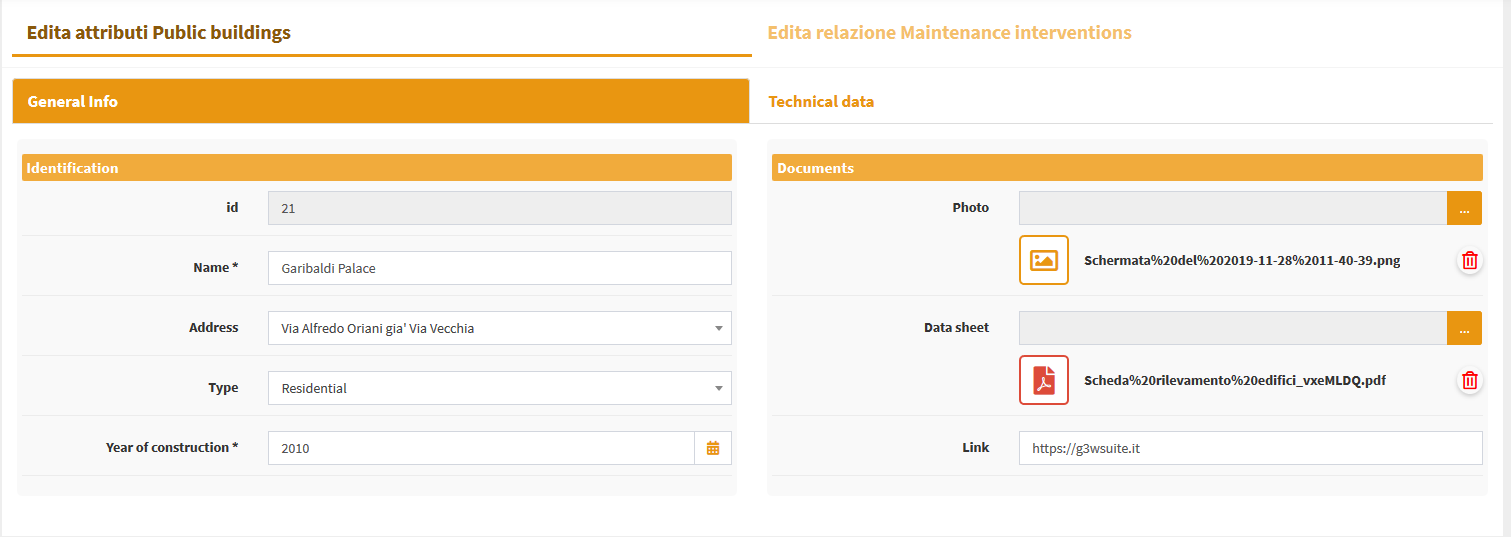
Query form e widget di modifica sono già definiti nel progetto per il layer: buildings e per la tabella relazionata ``*maintenance_works.
Buildingsid (integer - primary key): autogenerate
name (text NOT NULL): text edit
address (text): Value relation (roads layer - code/name fileds)
zone (text): text edit (with default values based on a QGIS expression to for association with the intersecting works area)
type (text NOT NULL): unique values (Administrative, Commercial, Residential)
subtype (text NOT NULL): value relation (based on type_subtype table for a drill-down cascading forms)
attachment (integer): check box 1/0 (the visibility of the conditional form Documents is based on this field)
photo (text): attachment
link (text): text edit
form (text): attachment
user (text): text edit (automatically filled in with the G3W-SUITE username creator of the feature)
year (integer NOT NULL): unique values (2015,2016,2017,2018,2019,2020)
high (integer NOT NULL): range (10-30 step 2)
volume (integer): range (50-200 step 10)
surface (integer): text edit
architectural_barriers (text): Checkbox (Checked - Not checked)
date_barriers (date): date (yyyy/MM/dd)
safety_exits (text): checkbox (Checked - Not checked)
date_exits (date): date (yyyy/MM/dd)
fire_system (text): Checkbox (Checked - Not checked)
date_fire (date): date (yyyy/MM/dd)
Maintenance_worksid (integer - primary key): autogenerate
id_buildings (text - relation key): text edit
maintenance (text NOT NULL): unique values
date (date): date (yyyy/MM/dd)
form (text): attachment
value (integer): range (10-30 step 2)
outcome (text): unique values (good, medium, bad)
responsible (text): text edit
cost (integer): range (1000-5000 step 1)
validation (boolean): checkbox (0/1)
Buildings ratingid (integer - primary key): autogenerate
id_buildings (text - relation key): text edit
date (date): date (yyyy/MM/dd)
value (integer): range (1000-4000 step 500)
year (integer): range (2018-2022 step 1)
To activate the editing function on webgis, access the list of layers and identify the three layers shown above.
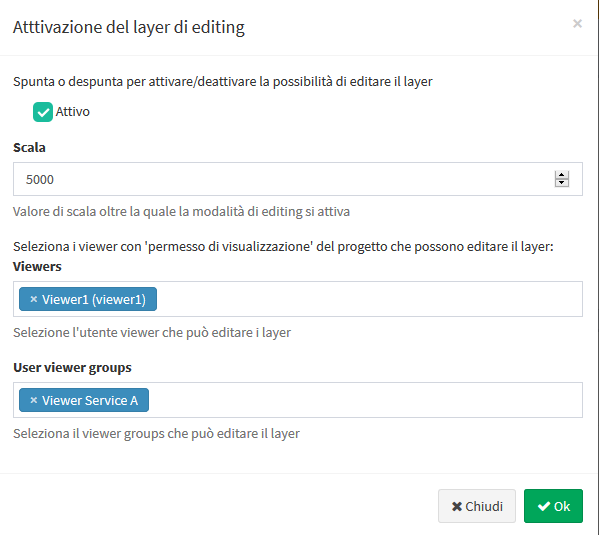
Cliccando sull”icona Editing layer ![]() (posizionata a sinistra di ogni layer) si aprirà un modale che permetterà di:
(posizionata a sinistra di ogni layer) si aprirà un modale che permetterà di:
definire la
scala di attivazionedel”editing (solo per le tabelle geometriche)definire gli
utenti Viewer(singoli o gruppi)abilitatiall”editing online «
Gli utenti Viewers (singoli o gruppi) disponibili nel menù a tendina saranno limitati a quelli che hanno permesso di accesso in consultazione al progetto WebGis in cui è contenuto il layer
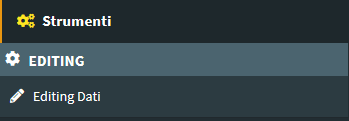
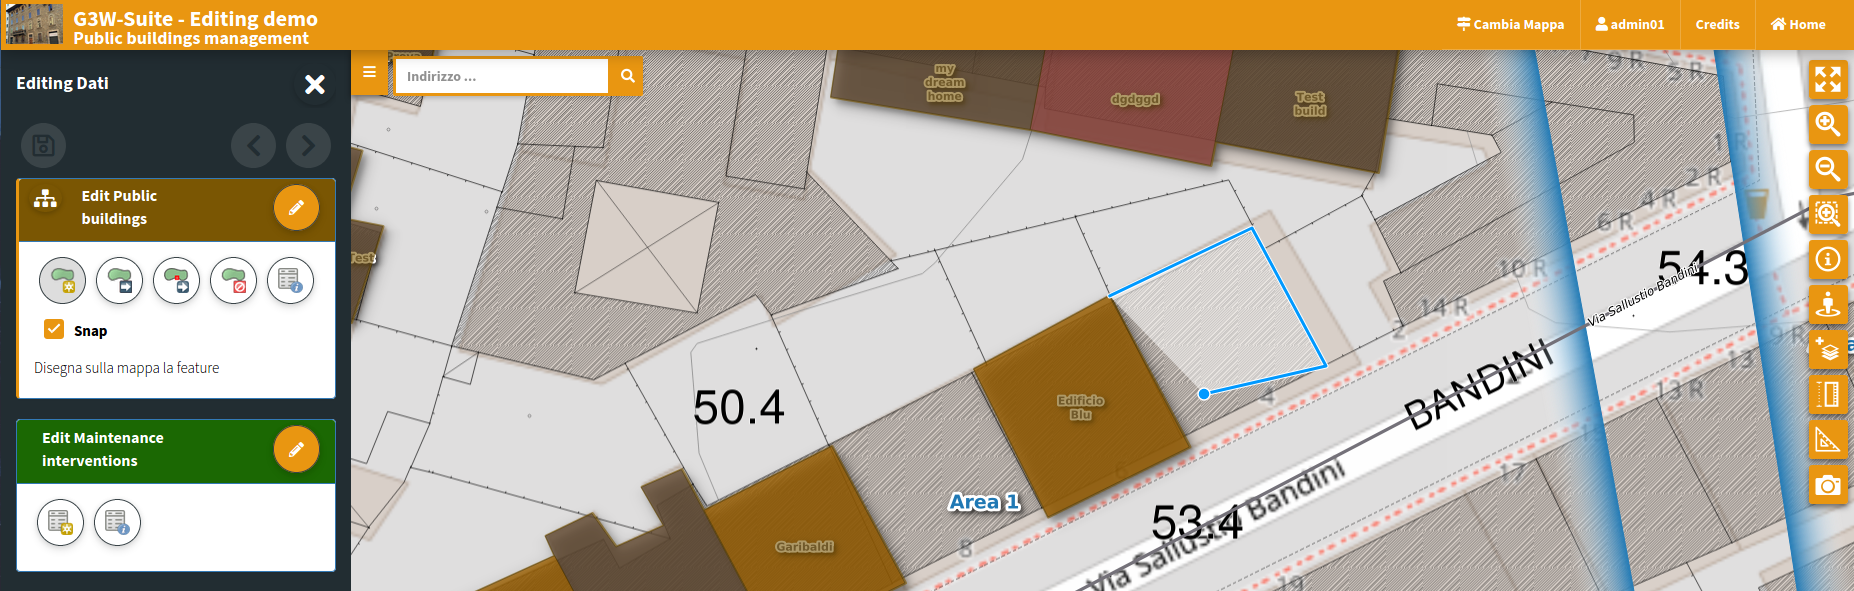
Attivata la funzione di editing, aggiornando il servizio WebGis, la voce Strumenti apparirà sul pannello di sinistra.
Attivando la funzione di editing sarà possibile modificare gli attributi delle features del layer degli edifici pubblici e dei relativi interventi di manutenzione
Per ulteriori informazioni sulla funzione di editing web, leggi il capitolo dedicato sul manuale.
Personalizza la tua demo
Vuoi testare più in profondità la funzione di editing?
Ridefinisci gli attribut form, gli alias e i widget di modifica associati ai singoli campi e ricarica il progetto per verificare le nuove impostazioni.
Prima però consulta il paragrafo dedicato all”elenco e alle limitazioni sui singoli widget di modifica ereditabili dal progetto QGIS