G3W-CLIENT: the cartographic client
Generic aspects
The application has a responsive interface consisting of expandable and reducible sessions.
Header

The contents of the header differ for the public user and for the logged in user
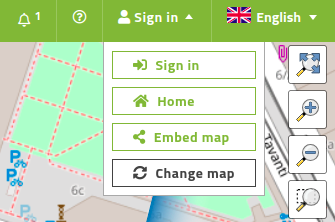
Public user (Anonymous user)
Logo, title and subtitle:, deriving from:
main title (set at General Data level) or MacroGroup name, according to the settings
Cartographic Group name
WebGis service title
Alerts: the Messages associated with the individual WebGis services and displayed when the services are started can be recalled by the user at any time. The message will be displayed on a resizable modal and can be consulted in overlay while continuing to interact with the various elements of the cartographic client.
Credits: references to the G3W-SUITE project
Sign in (far cambiare in Log in)
Sign in: login in for registered users
Embed map: URL with the references to the extension currently displayed
Change map: which allows you to switch from one WebGis service to another while maintaining extension and display scale
Language: the choice of language is reflected in the individual menus of the map client and on the contents of the access portal. The languages available are those activated by the Administration.
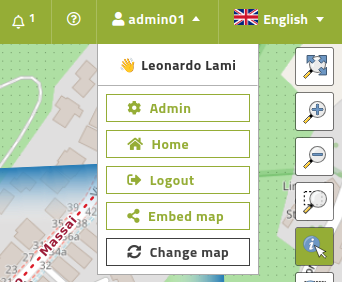
Logged user
Logo, title and subtitle:, deriving from:
main title (set at General Data level) or MacroGroup name, according to the settings
Cartographic Group name
WebGis service title
Alerts: the Messages associated with the individual WebGis services and displayed when the services are started can be recalled by the user at any time. The message will be displayed on a resizable modal and can be consulted in overlay while continuing to interact with the various elements of the cartographic client.
Credits: references to the G3W-SUITE project
User name: the name of the logged user
Admin: access to the administration section
Log out: log out the user
Embed map: URL with the references to the extension currently displayed
Change map: which allows you to switch from one WebGis service to another while maintaining extension and display scale
Language: the choice of language is reflected in the individual menus of the map client and on the contents of the access portal. The languages available are those activated by the Administration.
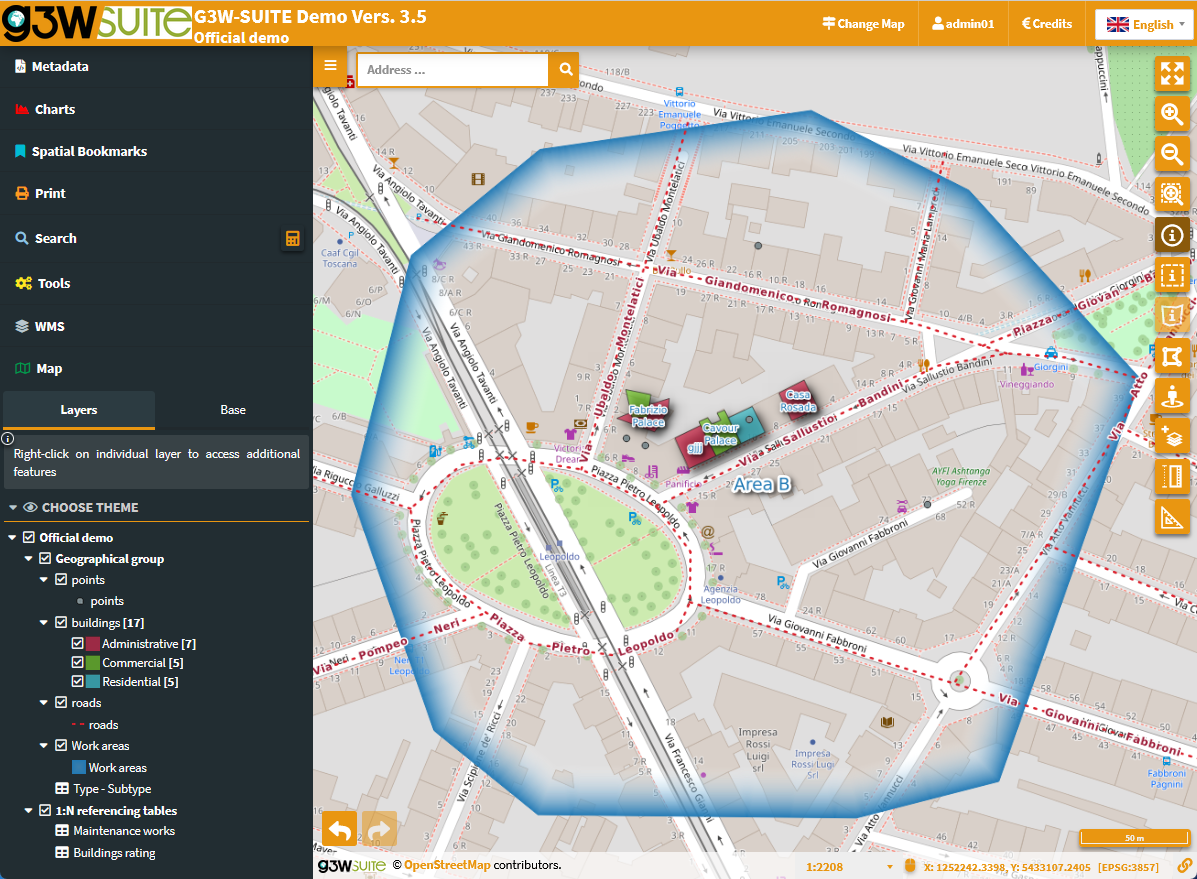
Main menù
The Main menù is located on the left.
The upper section containing:
Metadata: any content defined in the GetCapabilities of the QGIS Project.Depending on the settings defined at the QGIS project publication level, this session may not be shown to the user.
Charts: visualization of the plots created on QGIS with the DataPlotly plugin
Bookmarks: tool for using the Spatial Bookmarks associated with the QGIS project and allowing the user to create new ones for his exclusive use.
Print: printing tool based on the layouts defined on the QGIS project
Search: with the search tools defined in the Administration session, as well as a free Query Builder like the one present in QGIS
Editing layers: open editing session
Add WMS: session to add custom WMS services to the map
The middle section containing:
Data: structured list of layers, defined on the QGIS project
Choose theme (view): if defined in the QGIS project
Base: choice of the base map from those defined at the creation level of the Thematic Group
Legend: graphic legend of the various layers. Depending on the settings defined at the QGIS project publication level, the legend can be inserted in a dedicated tab or integrated into the layer list as in QGIS.
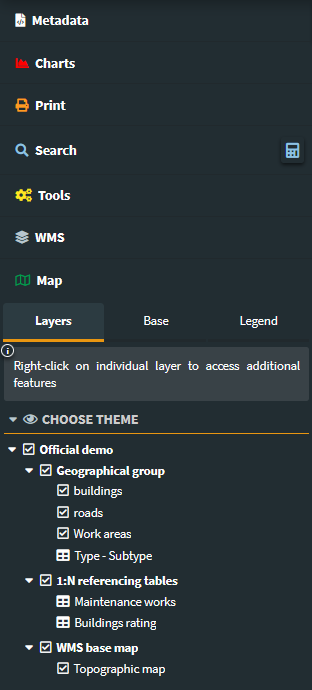
In the event that Themes (Views) are defined in the QGIS project, a specific choice menu will be available in the Layers session of the TOC.
The choice of a Theme will determine the automatic activation of the layers and related styles, defined in the Theme itself.
The lower section containing:
Add layer: session to add local vector layers or custom WMS services to the map
Change map: to switch from one WebGis service to another while maintaining extension and display scale
Navigation and interaction with the map
Map area
At the base of the map area there is an information bar showing:
mouse coordinates: coordinates can be shown in project projection system and in WGS84 LatLong (ESPG: 4326)
project projection system
share map: t icon to share the map bringing back various customizations
display scale
share map icon: this tool allows you to share the WebGis service while maintaining the customizations defined by the user (map extension, layers on/off, styles associated with the layers…) including, if present, the annotations created.

Map controls
The icons and description of the functions of the various MapControls activated at the thematic group level are shown below.
Map-controls available on the left side of the map:

Fit to extent: zoom to the initial extension
Zoom in and out: zoom in and zoom out
Zoom to box: zoom tool based on drawing a rectangle
Query layer: puntual query (all layer or only selected layer in the TOC))
Query area: areal queryThe panel that appears at the top left allows you to choose:
geospatial operator
intersects
within
kind of geometry to draw
rectangle
polygon
circle, specifying the radius also manually
polgyon of a layer in the map: features of one or more layers that intersecting/contained a polygonal element of a guide layer
layer/s to query, with the possibility of also querying a temporary vector layer, loaded on the fly

Geolocation: geolocation tool (useful for consultation from tablet)
Streetview: Google StreetView on your map. Due to Google policies, StreetView it will open on a new browse tab without the aspects of synchronization with the map
Add layer: tool for temporarily uploading GML, GeoJson, KML, GPX, SHP (zipped) and CSV with coordinate to WebGis, or to add a custom WMS service
Measure: linear and areal measuring instrument
Screenshot: tool to make a snapshots (PNG) or export (GeoTIFF) of the map visible area. Use the panel that appears at the top left to define your choice
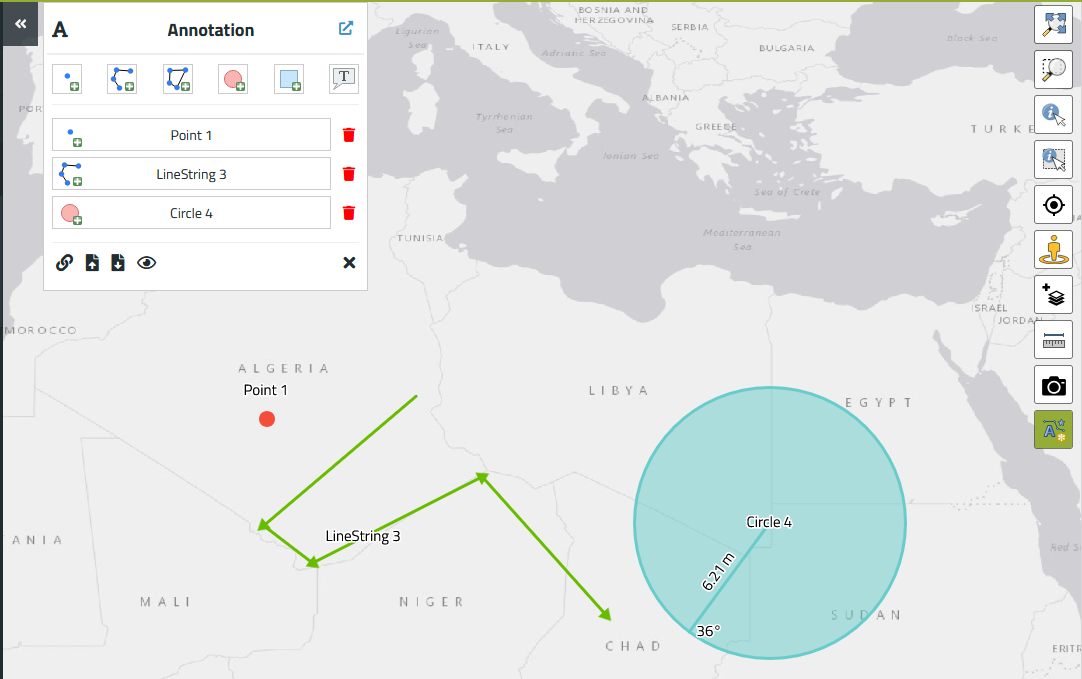
Redlinining: tool to add annotations or drawings objects to the map. For each of them it will be possible to define size, color, transparency, labeling and more. The elements drawn on the map will be shareable together with the other settings of the WebGis service and reported in the print output. The tool permits to create this type of annotations:point elements
free linear and polygonal elements
circle/rectangle elements
text labels
Here is an example of using the annotation tool
Map-controls available on the bottom left corner of the map:

Zoom last/next: undo/redo tools to navigate previous and post visualization areas (icons in the down-left corner)
Map-controls available on the top left corner of the map:

Geocoding: search tools for addresses and toponyms based on OSM or Bing, based on the providers activated at the administration level
Query type
![]() Point query
Point query
The point quey acts, by default, with the coring method, providing information relating to all the layers (setted as querable in the QGIS project) underlying the point where you click with the mouse or draw a box.
To query a single layer, it must be previously selected at the TOC level.
![]() Area query
Area query
Area query allows you to query project layers based on polygonal geometry:
draw: rectangles, circles or free-form polygons
deriving from a feature of a polygonal layer present in the project or added by the user
The result of these type of query can be based on the geometric operations intersection and containment.
The choice made via the drop-down menu allows you to move from one result to another dynamically.
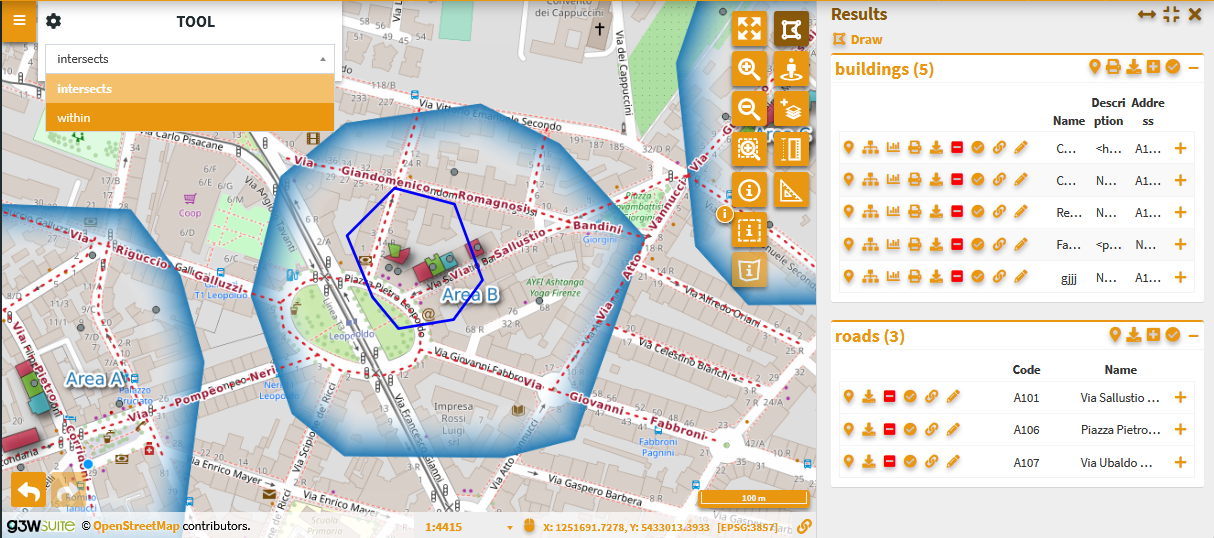
The Query area tool works also on the layers added using the AddLayer tool
NB: it will be possible to zoom on the feature associated with the individual results only if the option Add geometry to object response has been activated at the QGIS project level (Project → Properties, QGIS Server session).
Map query
In the QGIS project (Vector properties → Attributes Form), you can create custom attribute forms (tabs, groups …)
Upon querying a geometry, the form structure will be replicated at the client level.
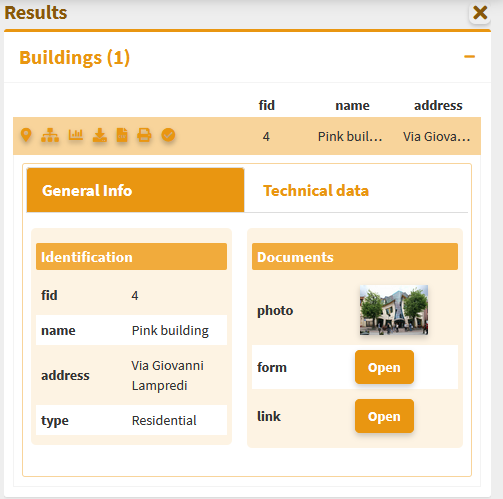
Any links to photos will determine the display of a clickable preview, any links to links or other multimedia content will determine the display of the Open button that will allow consultation of the link.
For further information on this point, see the dedicated paragraph.
Single result
In case the query provides one single result, the attributes will be displayed according to the form defined in the QGIS project or as a column list
The bar above the query results shows the following icons:
![]()
Zoom to feature: if the function is activated on the Properties of the QGIS project
Show relations (1: N): if present on the QGIS project
Show relation charts: display of plots related to 1: N related data. Only if 1: N relationships are associated with the interrogated layer and plots have been activated on the referencing tables.
Print Atlas: prints the reports (atlas) (if set on QGIS project) related to the queried feature
Download single results (Shapefile, GPK, GPX, CSV, XLS): if activated in the administration session
Remove feature from result: remove the feature to the current list of results (useful to choose manually the list of objects to select/download)
Add/Remove selection: add/remove the features to the current selection
Copy map URL pointing to the geometry : to create a parameterized URL that points to this features
Editing: to start editing directly on this feature
Multiple result
In case the query provides more results these will be listed as a list with the possibility to expand the detailed information.
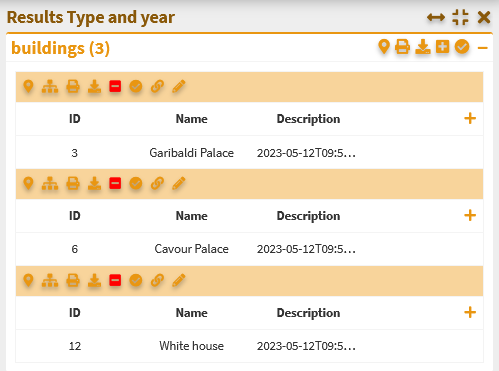
A series of icons, relating to the list of resulting features, will allow you to:
![]()
Zoom to features result extent: if the function is activated on the Properties of the QGIS project
Print Atlas: prints the reports (atlas) (if set on QGIS project) related to all the features result
Download all the features results (Shapefile, GPK, GPX, CSV, XLS): if activated in the administration session
Add feature on result: add features (clicking on the map) to the current list of results (useful to choose manually the list of objects to select/download)
Add/Remove selection: add/remove the list of features result to the current selection
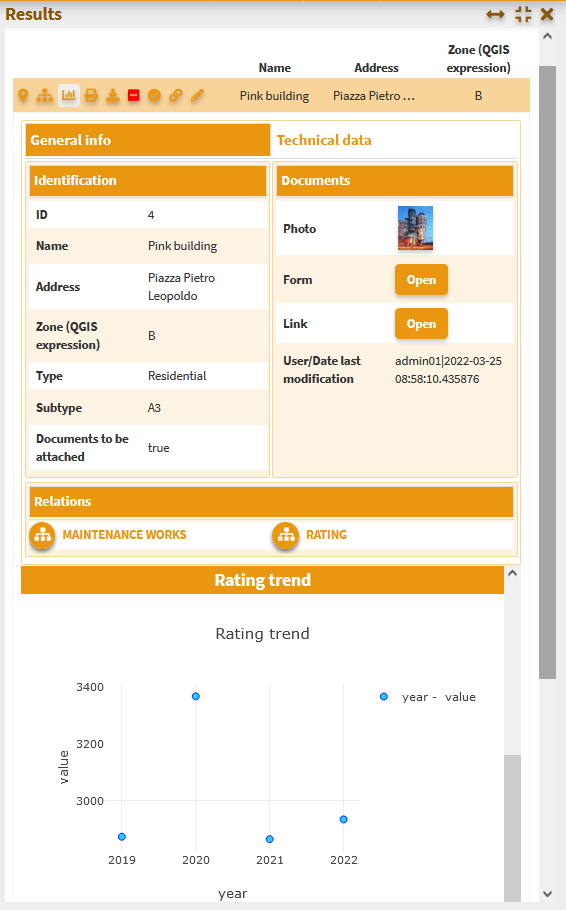
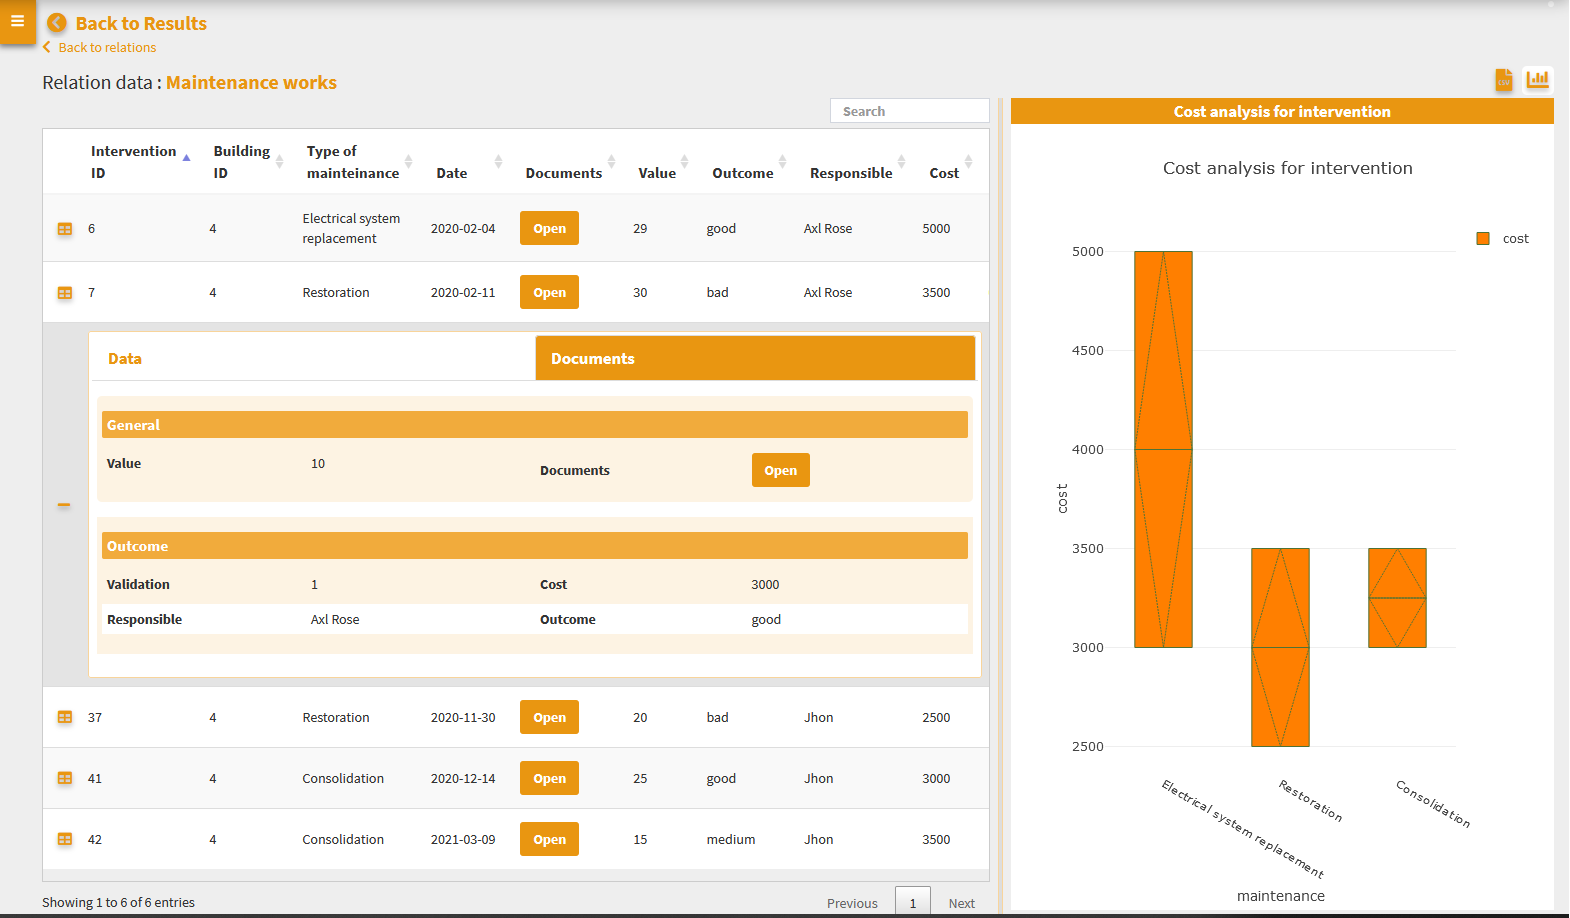
Display of 1:n relation data
In the event that, at the QGIS project level, one or more type 1:n relations have been associated with a layer, the icon View Relationships will be shown in the attribute form.
By clicking on the icon you will access the list of 1:N relations present and, from these, the list of child records associated with the individual relationships.
In the case of a simple 1:1 or N:1 joins, the joined records will be displayed directly in the main form.
In the new frame, a filter, applied generically to the contents of all fields, will allow you to filter the list of child records.
The icon to the left of each record allows you to switch from the classic table view to the one based on any form defined on the QGIS project
In the case of links to multimedia contents, the previews of the images and/or the Open button will be displayed for consultation of different types of content.
In case of active plots on the related table, these will be displayed through Show charts at the top right.
Parameterized URLs
It is possible to create parameterized URLs for direct zooming to: geographical extension single feature by FID single/list features by value of a field
Here the URL parameters available:
map_extent (Zoom to map extent)
Ex:
<url_project>?map_extent=Xmin, Ymin,Xmax,Ymax
zoom_to_fid (Zoom to a specific feature by FID)
Ex:
<url_project>?zoom_to_fid=<layer_id>|<fid value>
ztf (Zoom to features defined on the basis of attribute values)
Ex:
<url_project>?ztf=<layer_id or layer name>:<field name>=<field value>
If Views (Themes) are set up in the QGIS project, it will also be possible to parameterize them in the webgis URL:
Ex:
<url>?map_theme=<theme_name>
Tools panel
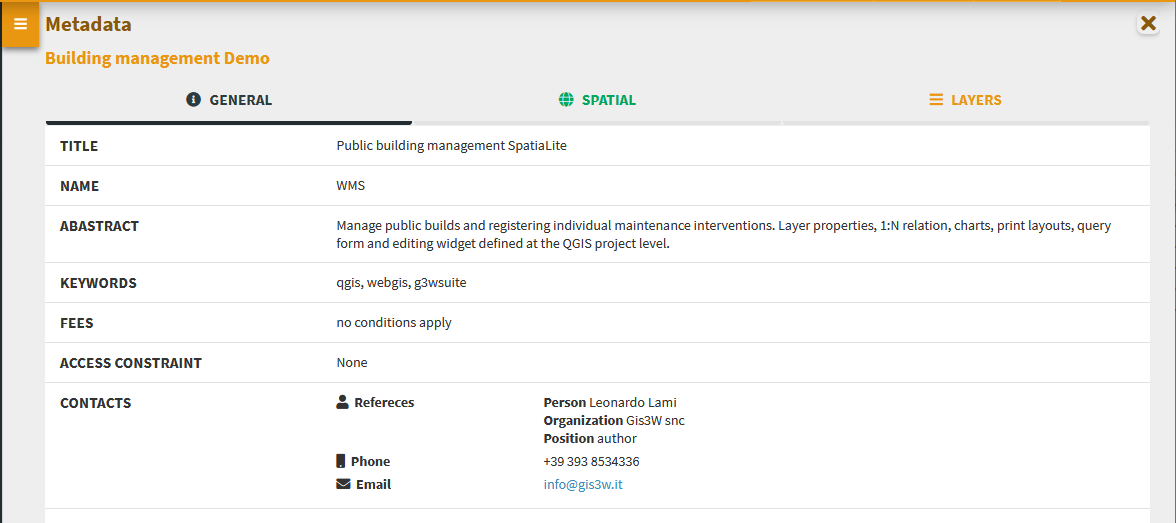
Metadata
The metadata reported in this session derive from those set at the QGIS project level.
Depending on the settings defined at the QGIS project publication level, this session may not be shown to the user.
This content is divided into three sessions: General, Space Info and Layers.
General: reports the metadata defined on the QGIS project in the item:Project → Properties (QGIS Server session, Service Capabilities)In case of login as anonymous user the URL of the WMS service is shown.Spatial: reports the EPSG code of the projection system associated with the QGIS project and the BoundingBox relating to the initial publication extension, defined in the item:Project → Properties (QGIS Server session, WMS Capabilities, Advertised extent)Layers: reports simple metadata associated with the individual layers.Credits: references to the G3W-SUITE project
Bookmarks
This tool will display the spatial bookmarks defined and associated with the QGIS project.
The user, even if not logged in, will be able to create new bookmarks by simply positioning them in an area of the map and then clicking on the + button to define the Name to associate with the bookmark.
These bookmarks will be saved in the browser cache and therefore always available until deleted.

Charts
View graphs created using QGIS DataPlotly and activated at the admin session level.
Check the plots in the list and consult them on the rigth panel.
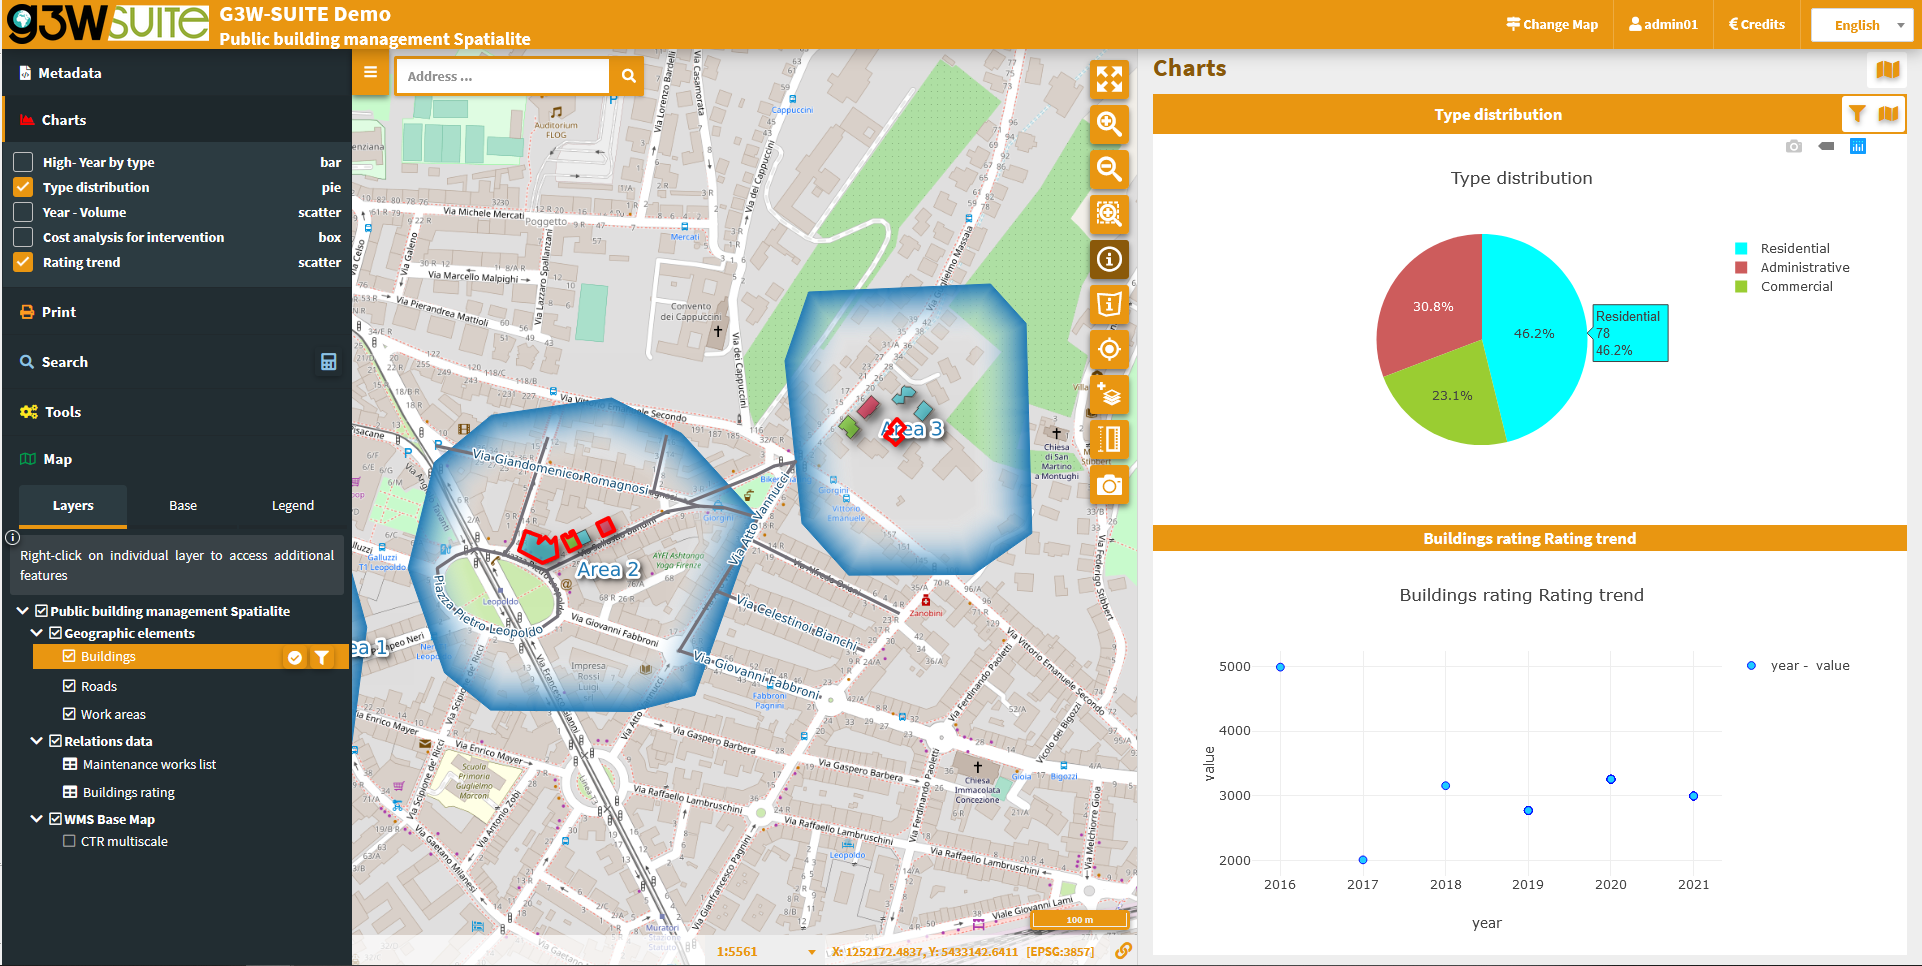
The graphs are filterable based on the:
 features visible on the map
 filter based on the selected features
These filters are also reflected on the plots associated to the related data (in 1:N mode) based on the visible and/or selected parent features.
The filter based on the map content can be activated globally on all plots (icon at the top of the panel dedicated to charts) or on only some specific plots (icon placed at the level of the individual plots).
The plots will automatically update after pan and zoom operations on the map
If activated, the filter based on the selected features is automatically activated on all related plots (associated with the same layer and with the 1:N relationed tables)
Appropriate messages at the single plots level will indicate the activation of these filters.
Charts based on 1:N data relation (child layer)
If the chart is linked to a child layer in a 1:N relation, it can also be displayed at the information level of the individual parent features
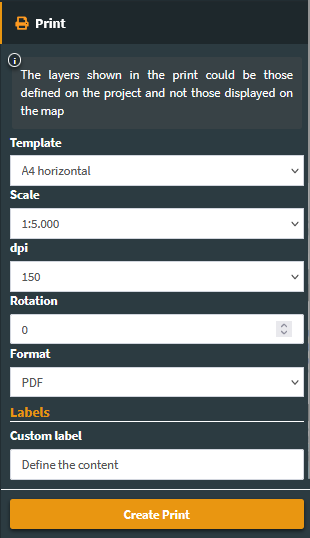
Print
Printing tool based on layouts defined on QGIS project.
The tool allows you to choose:
Template: print layout among those associated with the published QGIS project
Scale: print scale, with delfault values list, but also manually customizable
DPI: print resolution, with delfault values list, but also manually customizable
Rotation: rotation angle
Format: print to PNG, JPG, SVG, PDF or GeoPDF
Custom title: using the ItemIDs at the print layout level of the QGIS project it is possible to insert one or more labels with customized content in the print from WebGis
On the map, a light rectangular area will allow you to define the print area.
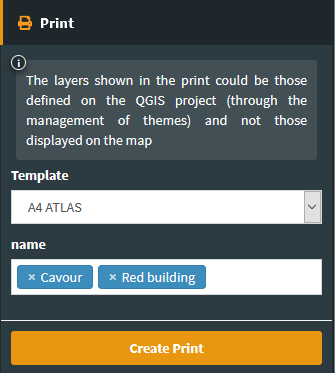
If an Atlas type print layout is associated in the QGIS project, the layout reference will be available. The cards to be printed are defined by referring to the atlas identifier defined in the print layout.
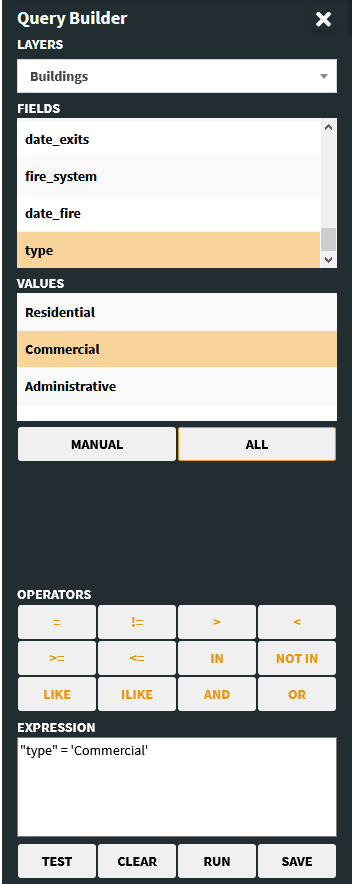
Search and Query Builder
A classic ![]() Query Builder is present at the Search menu level.
Through this tool it is possible to:
Query Builder is present at the Search menu level.
Through this tool it is possible to:
carry out alphanumeric searches on geometric layers
save the query to reuse it until the end of the work session
edit a previously saved query
The saved query will be available until the browser cache is cleared
NB: fields not exposed as QGIS project-level WMS are not available for query building.
The Search menu contains the list of search tools defined through the Administration panel and custom searches created with the Query Builder.
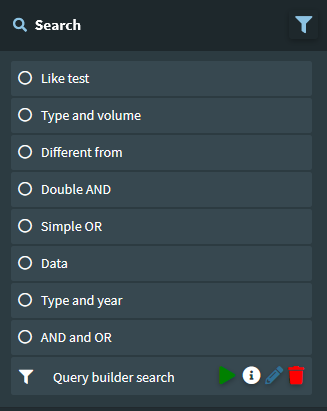
You choose the search you are interested in, fill in the required fields and click on the Search button.
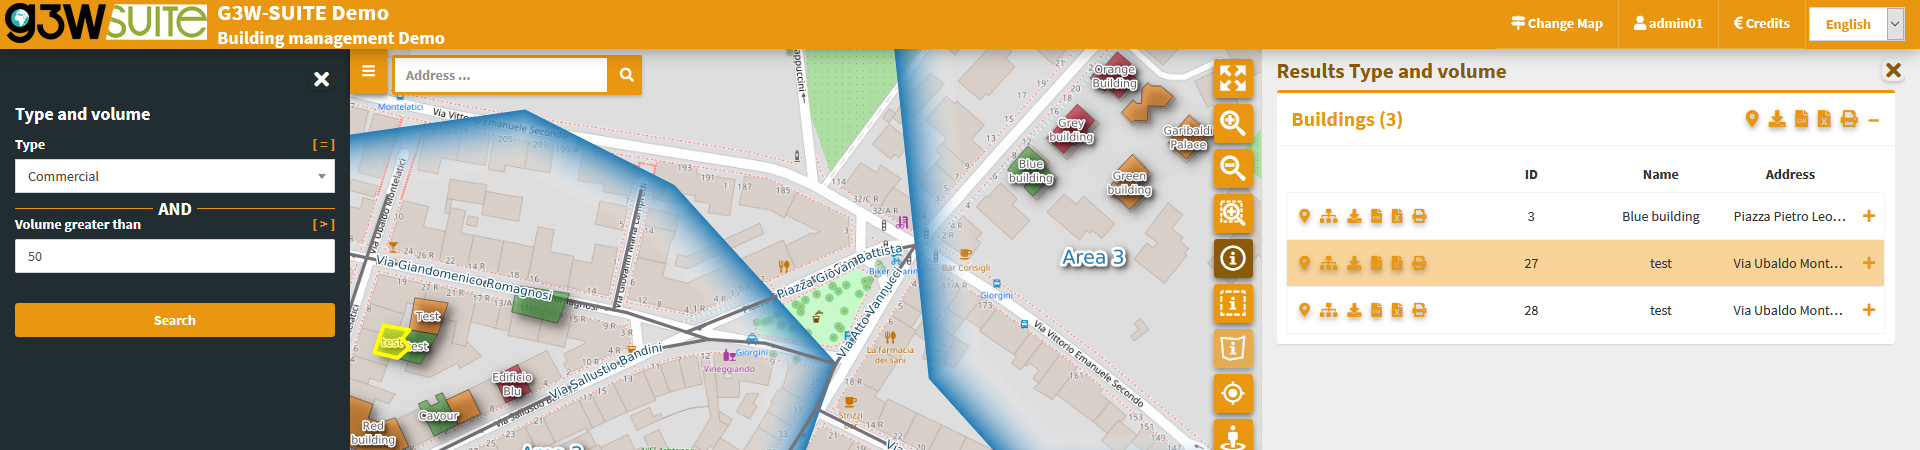
Additional information is displayed if you log in as Administrator
The panel with the list of results will open on the right side of the client, for each result the first three fields of the associated table will be displayed.
By positioning on the individual results, the corresponding features will be highlighted on the map; clicking on the individual results you can consult all the attributes.
Zoom to features and download icons are available for results (single or cumulative)
Editing layer
Activation of editing session.
Available only after activation of the editing function and based on the powers of the logged in user
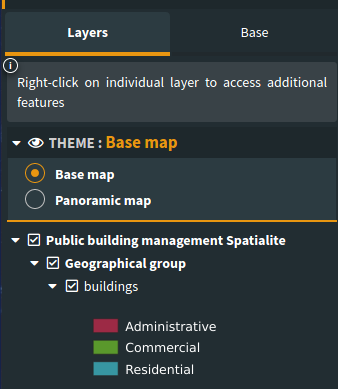
TOC session
Before the list of project layers there is session Choose Theme where it is possible to recall themes (views) defined in the QGIS project or create/save new ones if logged in.
This session has three tabs:
Data: structured list of layers, defined on the QGIS project
Base: choice of the base map from those defined at the Cartographic Group creation level
Legend: graphic legend
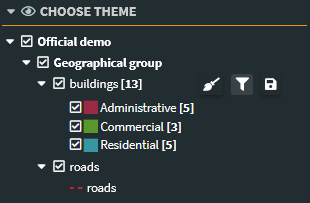
Choose Themes
In the event that Themes (Views) are defined in the QGIS project, a specific choice menu will be available in the Layers session of the TOC.
The choice of a Theme will determine the automatic activation of the layers and related styles, defined in the Theme itself.
User themes
The logged in user can create customized themes in the same way as he prepares them in QGIS, i.e. by defining the on/off layers and associating any specific styles with the individual layers.
By clicking on the + button it will be possible to define a name to associate and create the Theme.
The created themes will always be available to the user who defined them.
Once created, the User Themes will be selectable, overwritable and editable using the icons shown next to each of them.
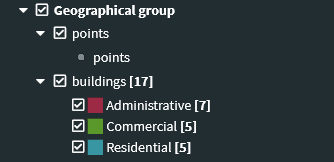
Data
This tab shows the layers prepared on QGIS projects with the same organization the groups and subgroups.
If the Show features count function is activated in the project, the layer will show the number of total features and based on the subdivision linked to the symbology.
In case of multi-style associated with the layer, the number of geometries reported will vary following the passage from one style to another.
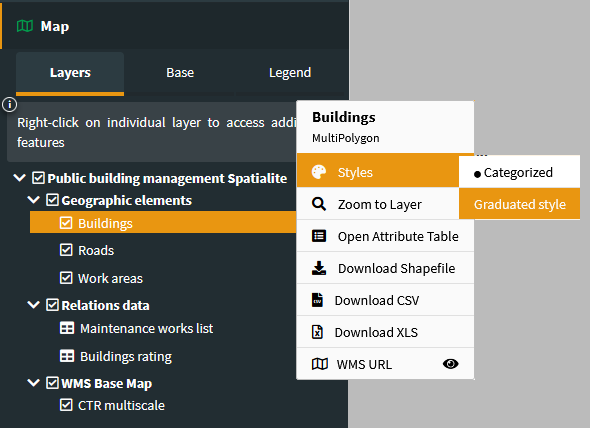
In the list of layers, right click on the name of the single layer shows the following items:
Name geometry type of the layer
Metadata: descriptive information inherited from what has been defined, at QGIS project level, in the ‘Abstract’ form of the ‘QGIS Server’ session of the ‘Layer Properties’
Edit layer: menu available following activation and based on user permissions
Zoom to layer: to zoom in on the extension of the layer
Open attribute table: to consult the associated attribute table
Styles: to choose the style to be applied to the layer, in the case of multi-style layers
Opacity: management of the level of transparency/opacity
Filters: management, based on the logged in user, of the filters associated with the layer
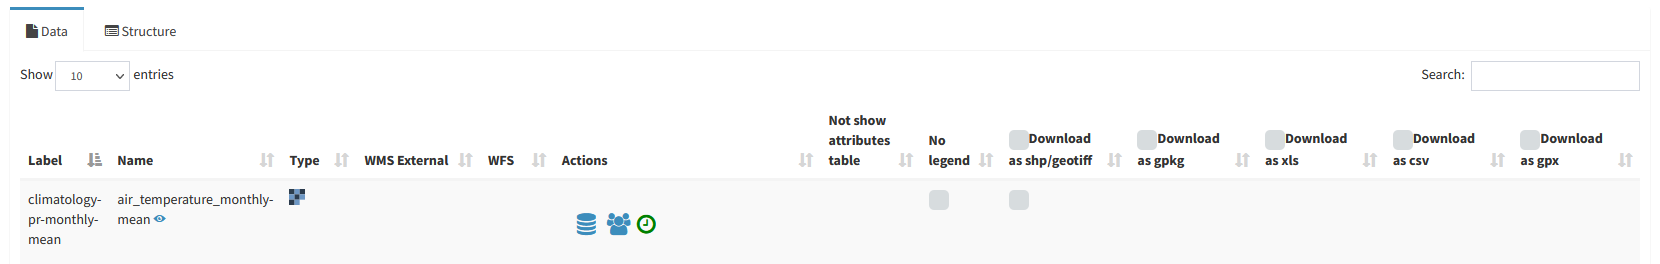
Save as: download of the layer in different formats, based on what is defined in the Administration session
OGC Services: URL of the WMS/WFS/WFS3 services relative to the project or URL of the external WMS layer
Layer settings: link to the layer administration section (available only if logged in as an administrator user)
Double clicking on the layer or Layer Group zooms to the extent of the layer or Group content.
It is possible to hide, automatically, layers from the TOC when they have no records.
Useful when using filters on layers or geographic views.
Attribute table
The attribute table (resizable) is equipped with paging function, highlight function and zooming to the associated features.
In the case of links to multimedia content, the previews of the images and/or the Open button will be displayed for consultation of different types of content.
To the left of each record in the table there are two/three tools:
checkbox to select the records/feature
the ‘Form view’ icon to open the feature attributes form
in the case of a layer editable by the user, the attributes table will show, for each record, an editing icon to allow direct modification of the feature
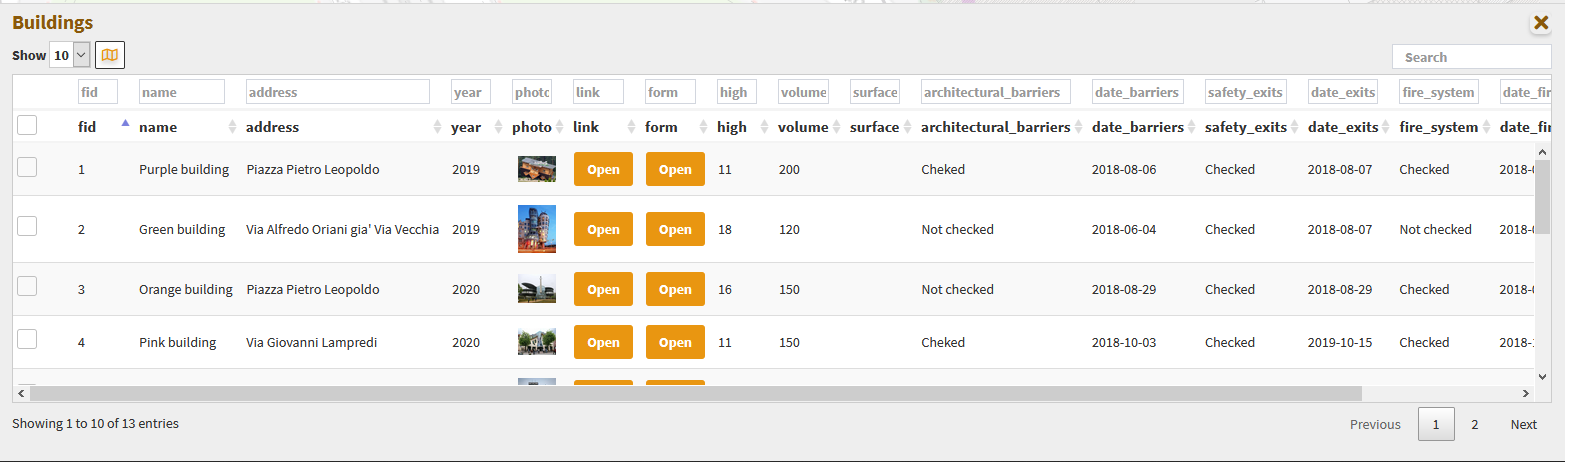
A generic filter, positioned at the top right, is applied generically to the contents of all the fields, and it will allow you to filter the list of displayed records.
Filters based on the contents of the individual fields are available at the top of each column.
The Update results when map moves icon  , located in the bottom left corner, allows you to filter the records of the table according to the features visible in the map.
It is possible to select the features of the individual layers and apply filters that will affect:
on the map content
on the attribute table content
on the contents of the plots
on print contents
on the editable geometries
The selection of features can be made:
at the attribute table level (through the checkboxes on the left of each records)
on the results of a query (add / remove from current selection)
on the results of a query (add / remove from current selection)
At the same time, additional icons appear:
on the layer attribute table, in the bottom left corner
to the right of the layer on the TOC
at the level of the relevant plots
The icons, palced in the left buttom corner of the attribute, table allow you to:
 Clear selection
 Invert selection
 Add/Remove filter
The icons to the right of the layer on the TOC allow you to:
Clear selection
Enable/Disable filter
![]()
When one or more features are selected, they appear highlighted in red on the map. Activation of the filter is reflected:
on the map content
on the attribute table content
on the data displayed by plots
on the print contents

Filter users based
On the client you can select (highlight) and filter a subset of vector layer geometries.
It is possible to activate a filter on a layer starting from:
query results
search results
attribute table management
To be filtered, the geometries object of the filter must first be selected.
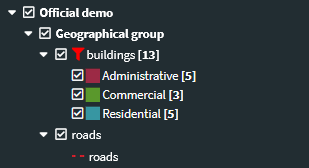
Following activation of the filter, a logged in user (not AnonymosUser) will be able to save this filter to be recalled in subsequent work sessions.
Saving the filter occurs via the dedicated icon present at layer level in the legend and in the results form.
The saved filters can be recovered via the dedicated menu that can be viewed by right-clicking on the name of the layer

The presence of an active filter on the layer is highlighted by the red icon next to the layer name.
To deactivate an active filter, simply click on the icon itself.
We remind you that activating a filter affects:
geometries visible on the map
records visible on attribute table
editable geometries
features underlying the graphs
print contenent
Base layer
The list shows the active base layers at the cartographic group level.
If the user has created base layers starting from cached layers, these may also be present.
Legend
If at the publication level of the QGIS project, the Legend position option i setted as TOC, this panel will be not present and the legend will be rendered inside layers TOC.
If the option is activated on the QGIS project, the legend is filtered on the map content.
Add layer
Through this tool the user can add custom WMS or local file layers to the WebGis service.
WMS (URL)
The user can add one or more WMS service by defining:
WMS URL
Name
Clicking on Connect buttom, it is possible to view the list of the layers associated with the service, choose which one to load by defining:
the Projection system to be associated
the Position (top or buttom) with respect to the other layers of the project
the Opacity of the layer
an alternatice Name respect the original
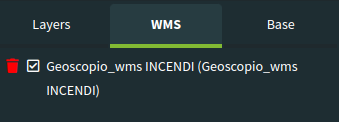
When the first custom WMS is added, a new tab (WMS) appears in the TOC; here you can switch on/off or delete the individual added WMS layers.
The added WMS layer cannot not be queried.
The list of WMS services and the specific WMS layers added will remain available to the user until the browser cache is cleared.
Also the WMS connections created will remain available for later reuse
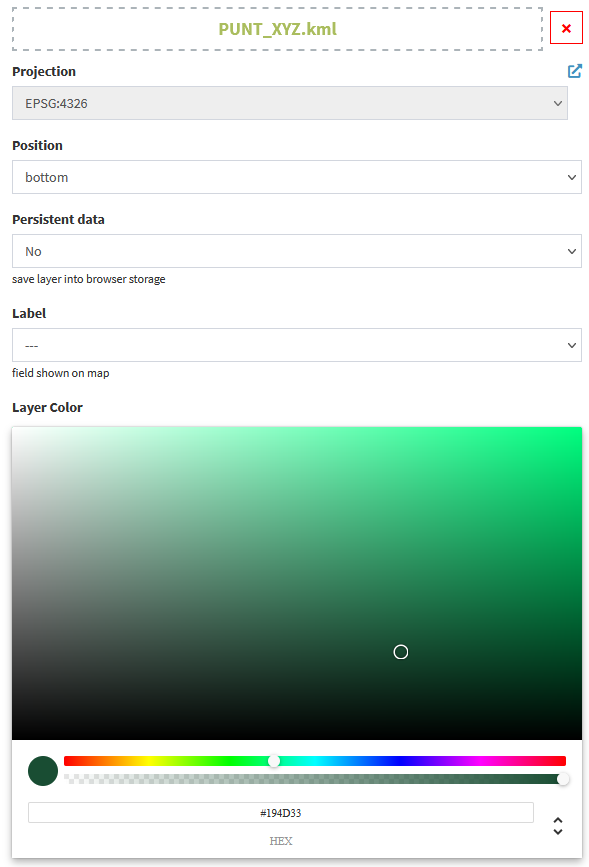
Local file
The user can add one or more local layer uploading it in the form.
The formats currently managed are:
gml
geojson
kml
kmz
gpx
csv
shapefile (zipped)
For each layer you need to specify:
associated Projection system
Position (top or buttom) with respect to the other layers of the project
Persistent data: allows you to specify whether or not the layer should be deleted when the session is closed
Label (optional): the field to use to label the features
Layer color and opacity
Change map
The menu allows you to switch to a different map, among those accessible to the user, referring to the current extension and scale.
Time series
NB: the Time Series function is only available with a QGIS Server version >= 3.26
This version of G3W-SUITE manages the temporal aspects for both vector and raster layers but with limitations:
vector layers: limited to the Single field with Date/Time configuration
raster layers: Mesh layer
WMS-T
It is possible to create animations based on multiple temporal layers both raster and vector.
If in the QGIS project a temporal vector/raster layer on which the Dynamic temporal control property has been activated is present, the client will show an additional panel called Time series.
This panel will allow you to:
define the start/end date of the time series
define the step of the animation
start and manage the temporal animation
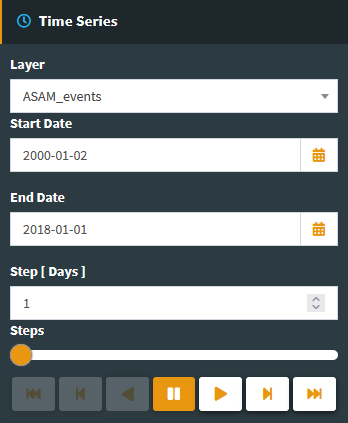
The modification of the start date of the series will determine the updating of the map with the visualization of the layer in coherence with the chosen date.
Pay attention: to use the Time series function for raster data, it must also be activated at the level of the G3W-ADMIN layer properties.