Introduction
The tutorial is based on a QGIS project dedicated to the management of a layer representing a series of buildings located on the territory.
In addition to the geographical aspects, the project involves the management of numerous and diversified attributes and of the related maintenance interventions through a 1: n type relation.
Through the tutorials it will be possible to:
customize the various graphic-functional aspects of the basic project
publish the project as a WebGis service
create personalized searches
add plots made with DataPlotly QGIS plugin
activate the editing functionality by customizing associated forms and widgets
Download demo data
The tutorial is based on predefined data and QGIS 3.40.x LTR project downloadable from this link.
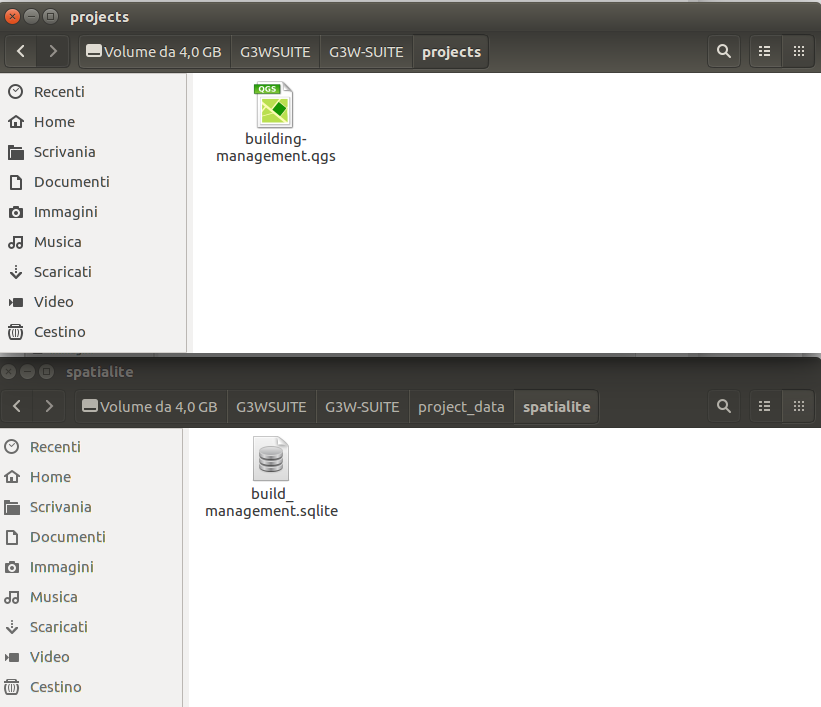
The .zip file contains the G3W-SUITE directory with three sub directories:
projects: containing a QGIS project (public-buildings-management-demo-310.qgs) already optimized for the tutorialproject_data/spatialite: containing a SpatiaLite DB with basic data (build_management_demo.sqlite)plots: containing a a series of plots created with the DataPlotly plugin and saved in xml format
Inside the build_management_demo.sqlite SpatiaLite DB there are the following layers:
buildings(polygon layer): reference layer for editing aspectsmaintenance_works(alphanumeric table): with the maintenance interventions associated with the individual buildingsbuildings_rating(alphanumeric table): with the annual assessments relating to individual buildingsroads(linear layer): layer to define the address associated to any buildingswork_areas(polygon layer): with the perimeter of work areas to be used to define any geo-constraintstype_subtype(alphanumeric table): a decoding table of the type and subtype values associated with the individual buildings
IMPORTANT: a copy of this data are present on the server, you can not change your local data copy
The project (based on QGIS LTR 3.40.x) foresees:
a dressing categorized by the
buildingslayer based on the categorical fieldtypethe presence of a 1: n relation between the
buildingslayer and the alphanumericmaintenance_worksandbuildings_ratingtablespre-developed query forms for the
buildingslayer and themaintenance_workstablepredefined editing widgets for the fields of the two main layers:
buildings,maintenance_worksandbuildings_ratingtablestwo standard print layout and an two atlas print layout based on buildgs layer features
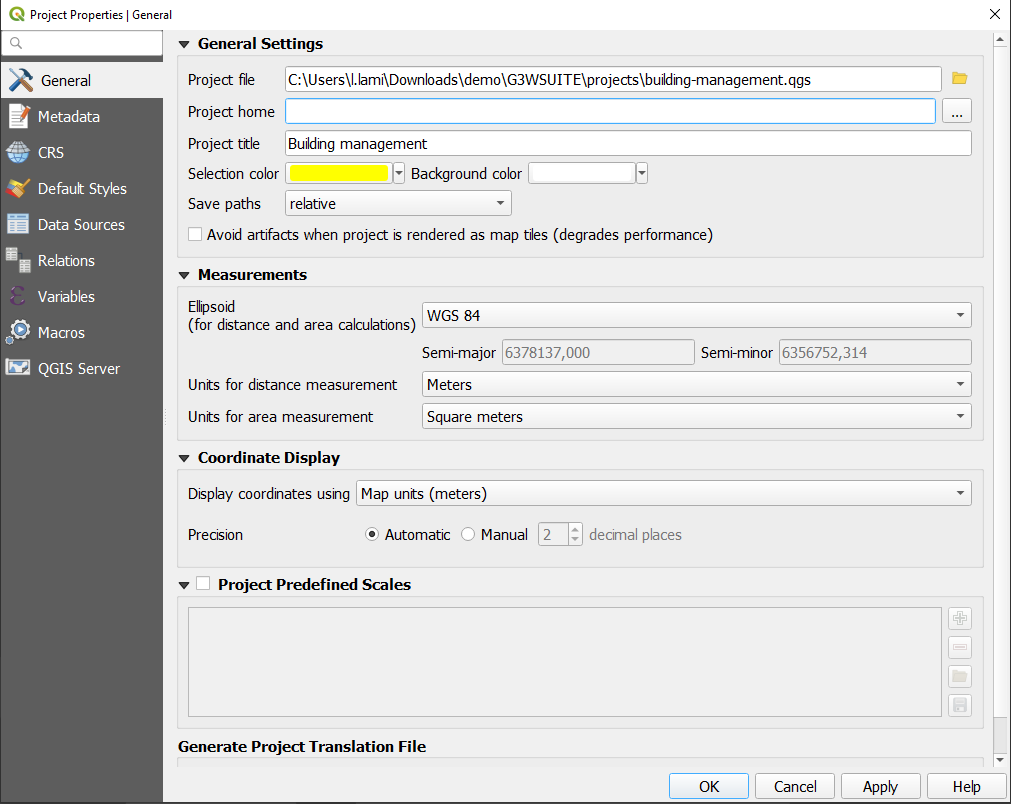
Modify the QGIS project title
The publication system provides for the use of the title of the project as the unique identifier of the WebGis service.
So, before publishing the project, it will be NECESSARY to change the title associated with the basic project (Project -> Properties ... - Session: General)
Access the online service
To publish the project, you can access the G3W-SUITE test application via the following URL: https://v310.g3wsuite.it
To access the Administration Panel it is necessary to log in using the following credentials:
user:
demopassword:
G3wsuite123
In case of login fails, report the problem to info@gis3w.it
Publish the QGIS project as a WebGis service
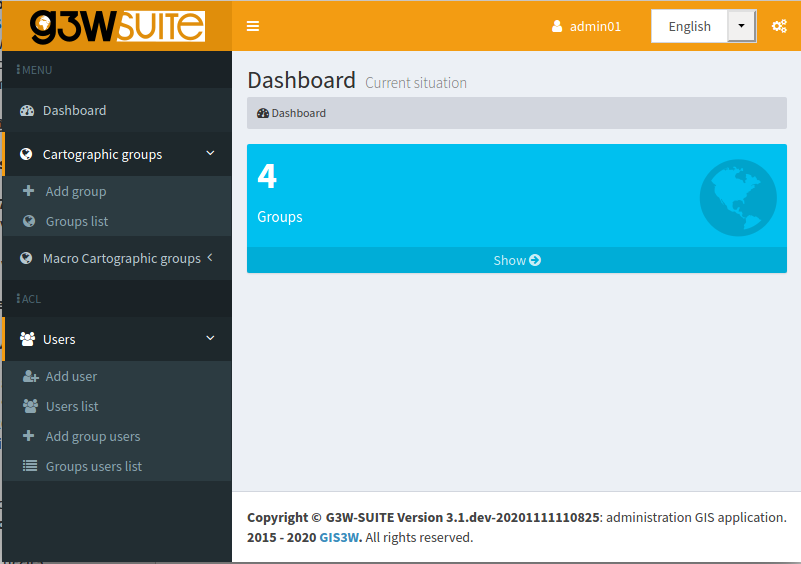
After authentication it will be possible to access the Administration session and view the Dashboard.
In the Dashboard there will be the menu for access to the Cartographic Groups pertaining to your user and the menus relating to additional modules not active in this demo.
Click on the Show item in the ligth blue Groups box to acces at the list of available Cartographic Groups.
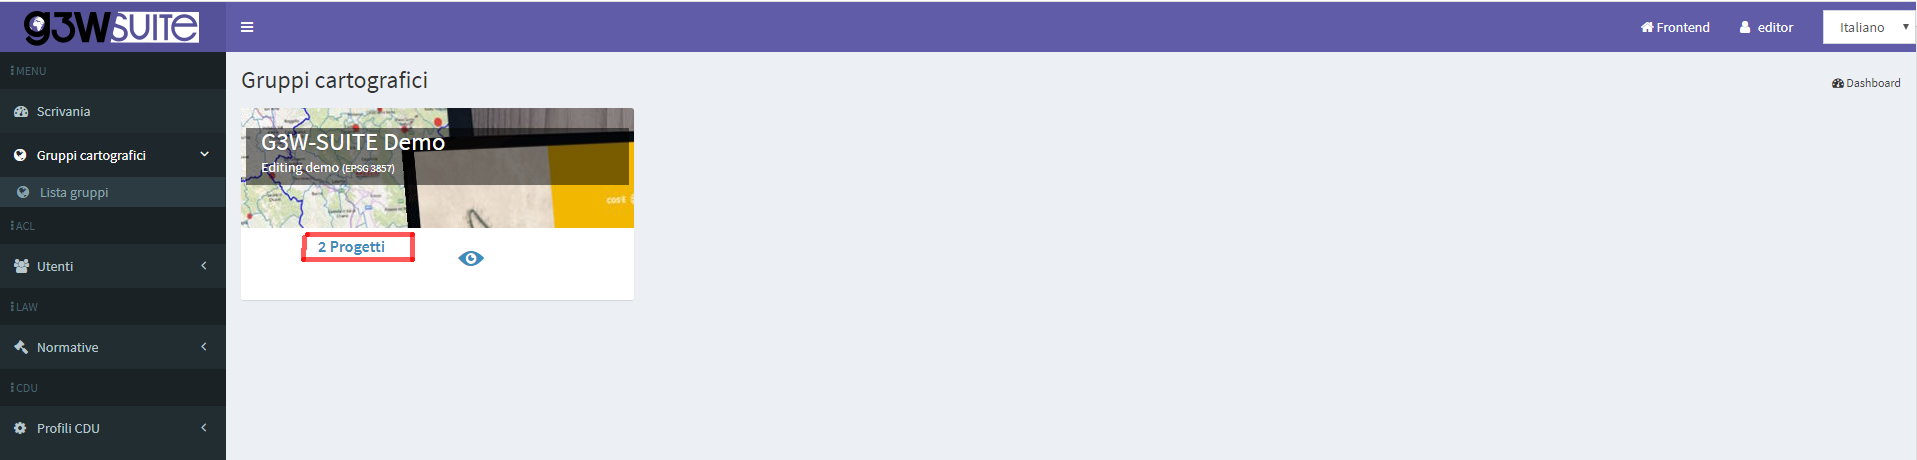
Access the list of webgis in the Cartographic Group Demo Group clicking on the project number shown.
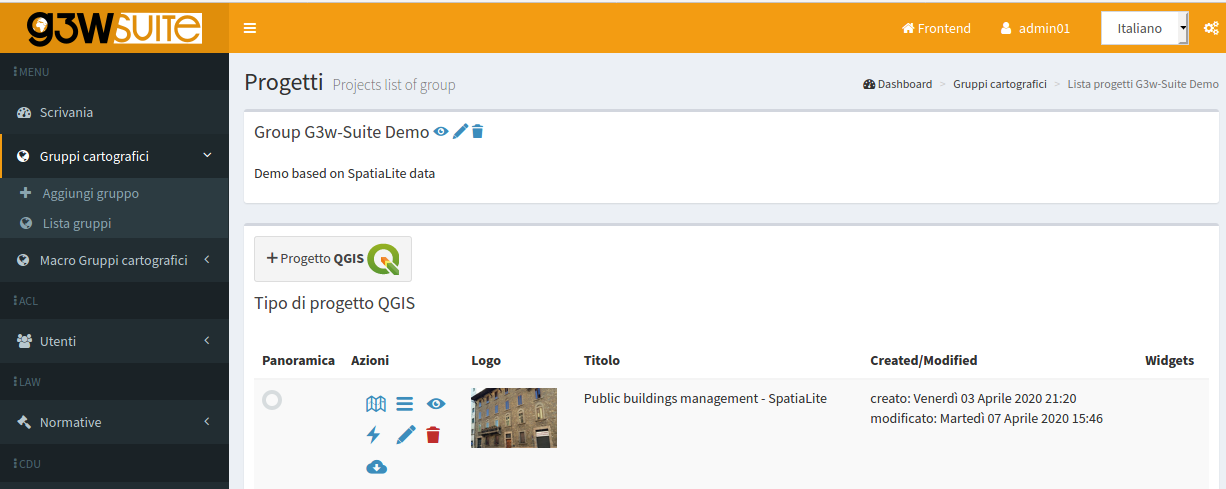
Now click on the button  to publish your QGIS project.
Fill out the form defining the various aspects to be associated with the WebGis service being published:
QGIS project
QGIS file: load the QGIS cartographic project to be published (.qgz or .qgs file)
ACL Users
Management of access permissions
Viewers users: define the individual users (Viewers) who have the credentials to view the WebGis service. By choosing the anonymous user (AnonymusUser) the group will be freely accessible.Viewer user groups: you define the user groups (Viewer) which have the credentials to view the content of the service.
Default base layer
In this session you define which base layer should be active at startup.
The choice is limited to the list of base layers activated for the cartographic group in which you work.
It is also possible not to define any active base layer at startup.
Description data
Public title: Title to be associated with the project and displayed on the client header. If left blank, the title associated with the QGIS project will be used or, in the absence of this, the name of the project fileDescription: Description of the project, it will appear at the public portal level.Thumbnail (Logo): logo to associate with the project. This image will be viewable in the list of projects within the cartographic groupURL alias: a human readable URL for the map
ATTENTION: contents marked with * are mandatory.
Options and actions
Choose your preferred options regarding the following options:
User QGIS project map start extent as webgis init extent:check this control if you want set initial extent from QGSI project initial extent, Project properties -> QGIS Server -> WMS capabilities (Advertised extent)Tab's TOC active as default:set tab’s TOC (Layers, Base layers, Legend) open by default on startup of webgis serviceLegend position rendering:this option allows to set legend rendering position:In a separate TAB: default value, the legend is rendered into a separate tab
Into TOC layers: the legend is rendered inside layers toc
Automatic zoom to query result features:if in the results of a search there are only features of a layer, the webgis automatic zoom on their extension
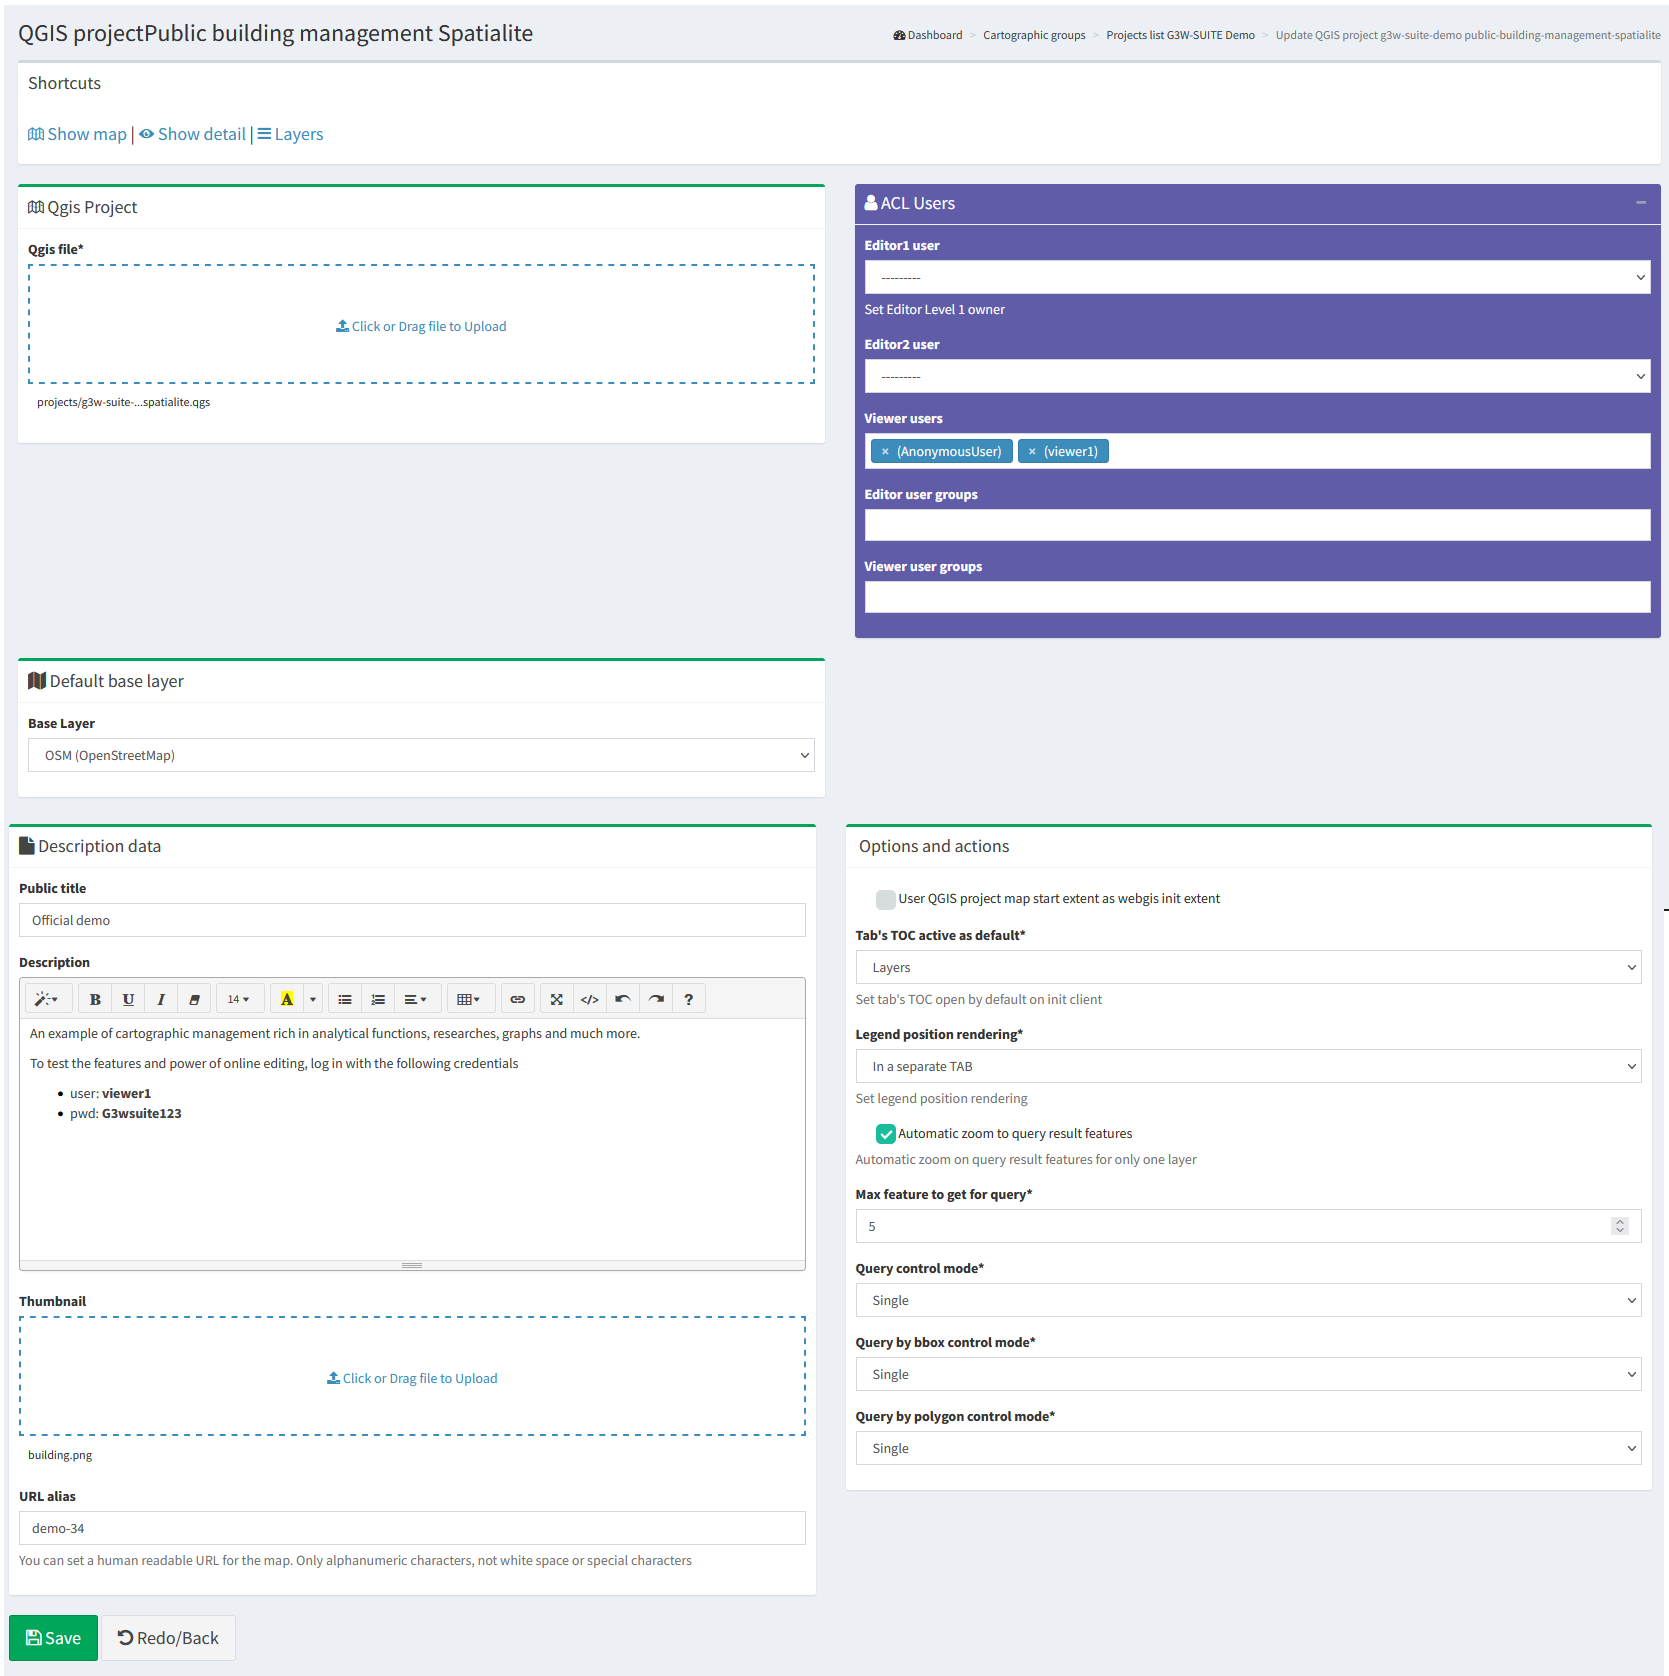
After filling in the various form, click on the Save button to confirm your choices.

If the publication was successful, the QGIS project will appear in the list of projects in the Cartographic Group.
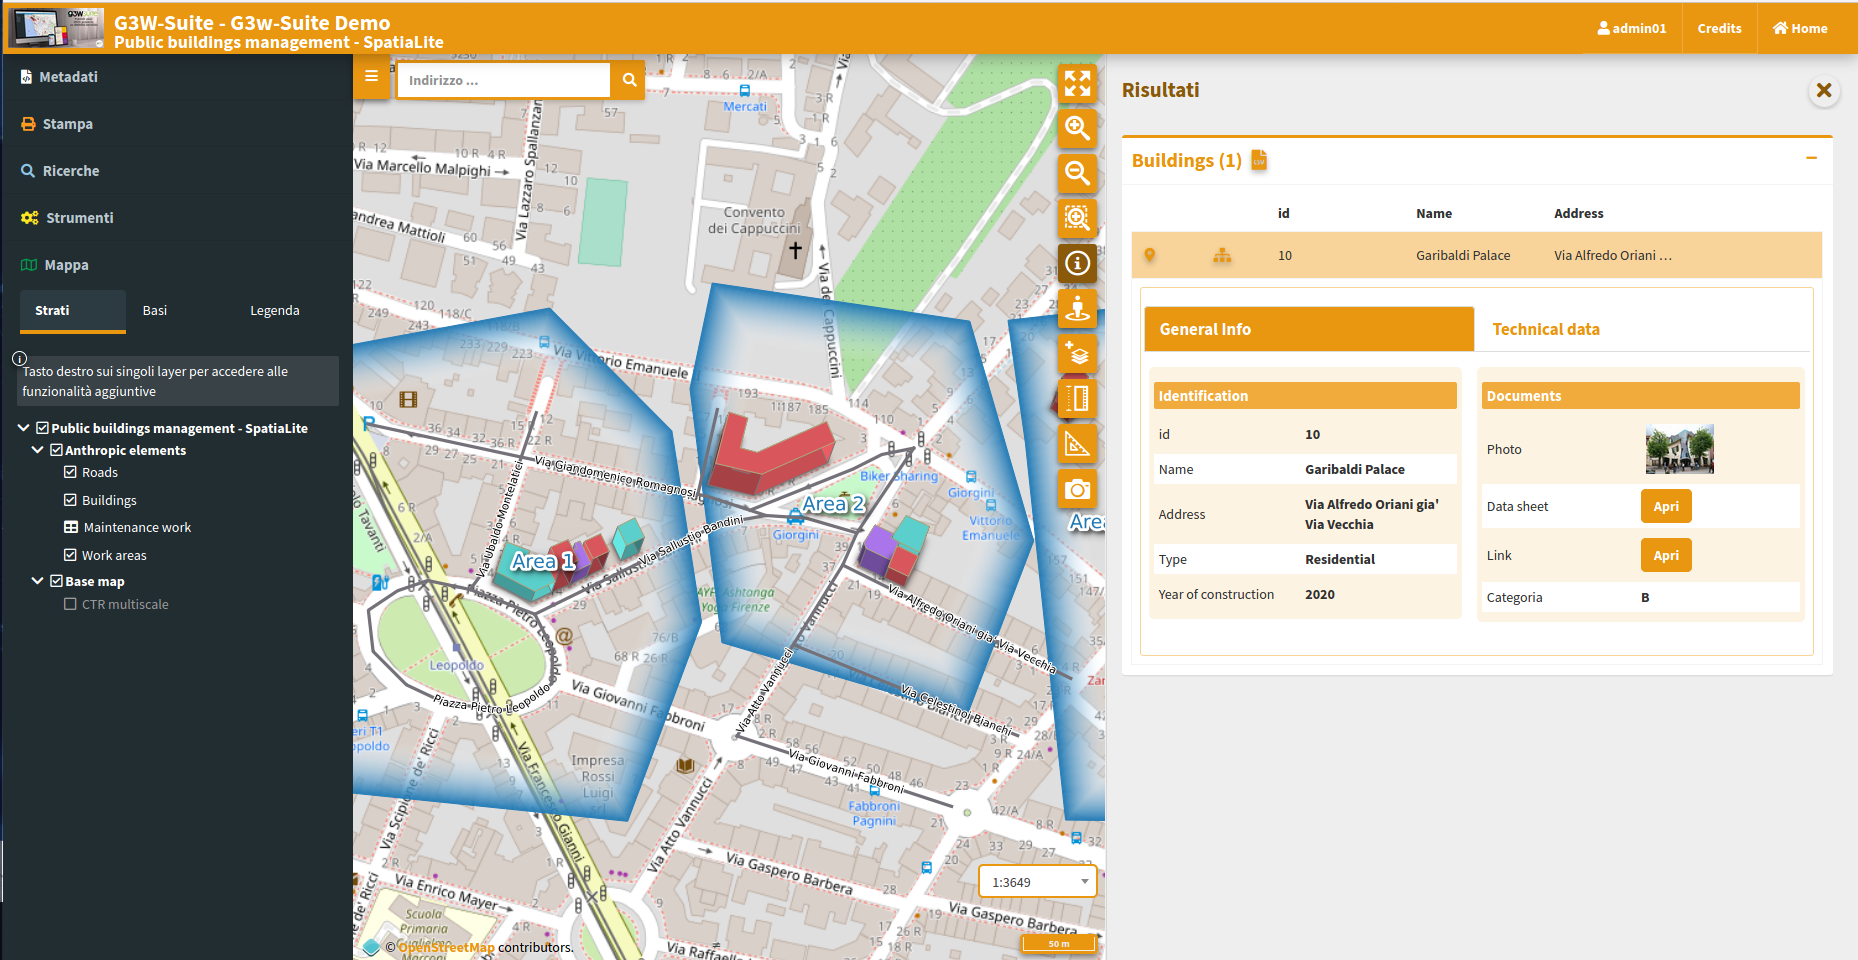
 Clicking on the
 View map icon will access the WebGis service in consultation.
Update the published WebGis service
If you want to modify some graphic-functional aspects of your WebGis service, modify your QGIS project and update the WebGis service by clicking on the Modify icon  .
.
Reupload the QGIS project with your changes, click on the Save button and see the resuts on the cartographic client.
Activation of additional functions
Once your project has been published, you can access the list of widgets and additional functions to enrich your WebGis service.
Widget management
Thougth the Layers list icon  it is possible to access the list of the geographical states that compose it and define some functional aspects that will be enabled at the cartographic client level.
The new session will show you the list of the layer present in the published QGIS project
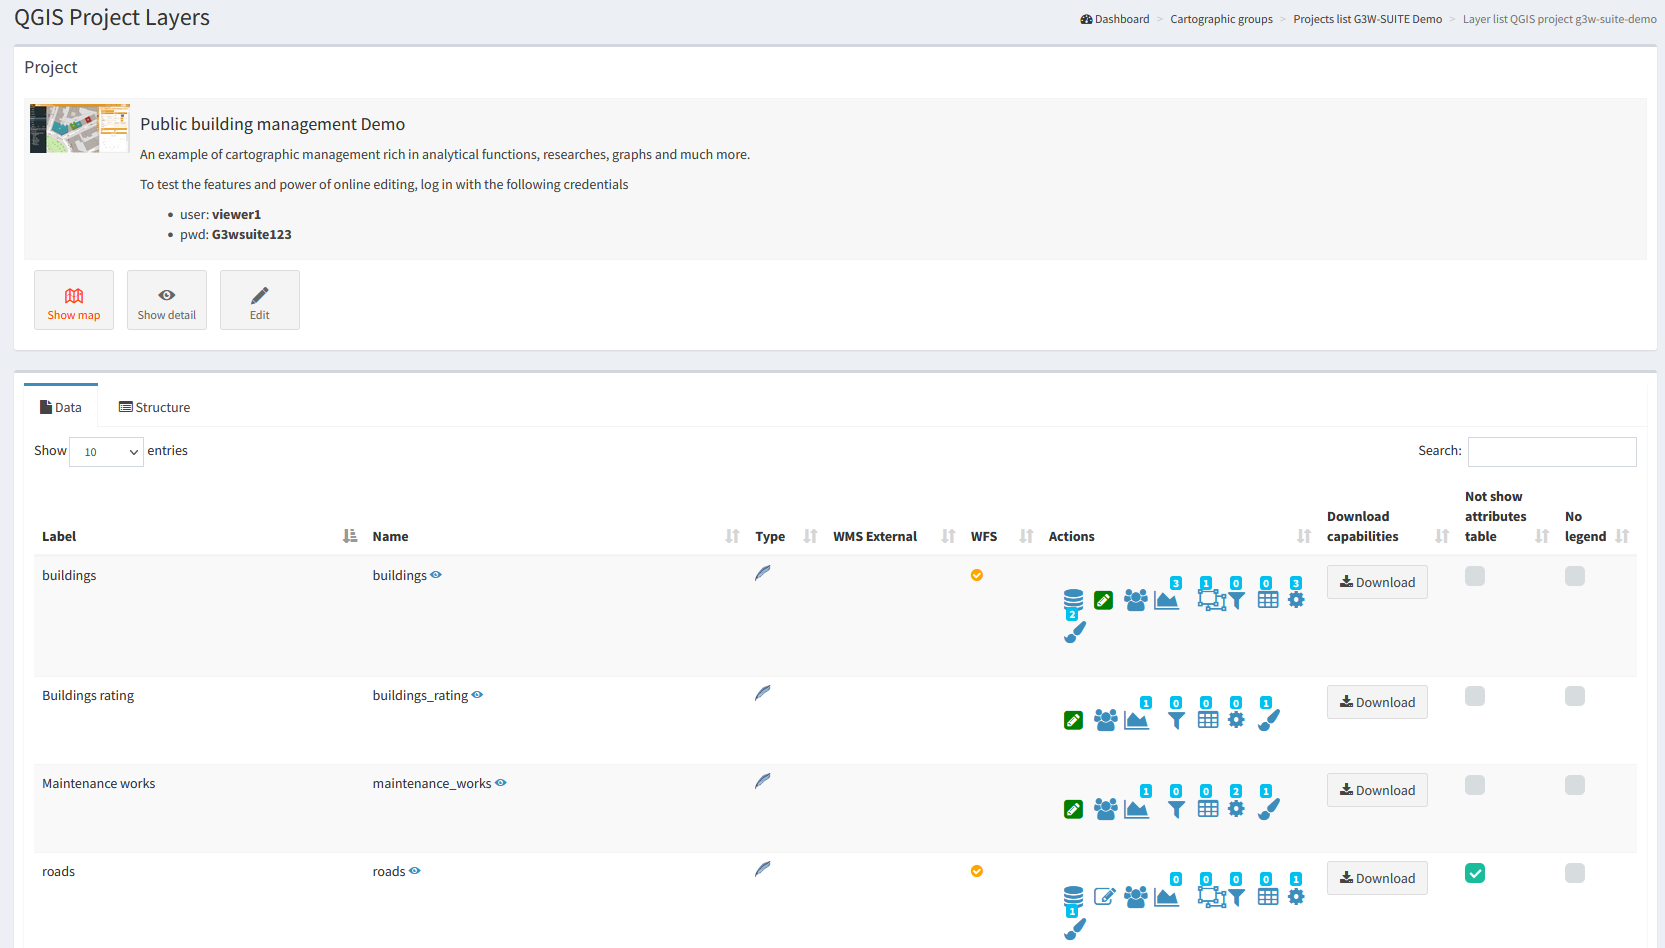
Label: layer alias applied at the QGIS project level
The blue eye icon
 allows you to know the ID associated with the layer at the project level, this ID will be useful for creating parameterized URLs
Name: name of the layer (file or DB table)
 Type: illustrates the type of data (WMS, PostGis, SpatiaLite, GDAL / OGR …)
WMS external: to speed up loading, the WMS layers present in a QGIS project are managed directly by Django and not by QGIS-Server.
In case of non-external WMS, the service is managed by Django and this eliminates cross-domain problems but the only managed GetFeatureInfo response type is GML.
The external WMS option allows obtaining a response to the query (GetFeatureInfo) even if the response is not in GML but also in HTML or text/plain format.
The option is available only if the WMS loaded on the QGIS project is associated with the same projection system as the project.
WFS: a check mark shows whether the layer is published as a WFS service or not
Actions: a series of icons dedicated to various functions
 Caching Layer: allows you to activate and manage the cache of the single layer at the project level
 Editing layer: shows if the online editing function is active on the layer and allows you to activate and define it
 Hide layer by user/groups: hide specific layers from the TOC based on specific users or groups of users
 QPlotly widget: add or manage plots created with DataPlotly QGIS plugin
 Geo-constraints by user/group: create or manage editing and visualization geo-constraints based on poligonal layers
 Alphanumeric and QGIS expressions constraints by user/groups: create or manage editing and visualization constraints based on SLQ language or QGIS expressions
 Hide columns by User/Groups: create or manage constraints on one or more fields of a layer based on single or group user/s
 Widgets list: shows how many widgets (eg searches) are associated with this layer and allows you to activate new ones
 Manage layer styles: manage multi-style layer
 Scale visibility layer by Users/Groups: allows you to define a visibility scale differentiated by user and/or user groups. Activating this option will overwrite, for the layers involved, any display scales defined at QGIS project level
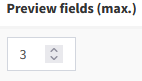 Preview fields (max): allows you to define the number of fields shown in the preview of the results of a search and query. HTML formatting and image previews are managed in the preview fields.
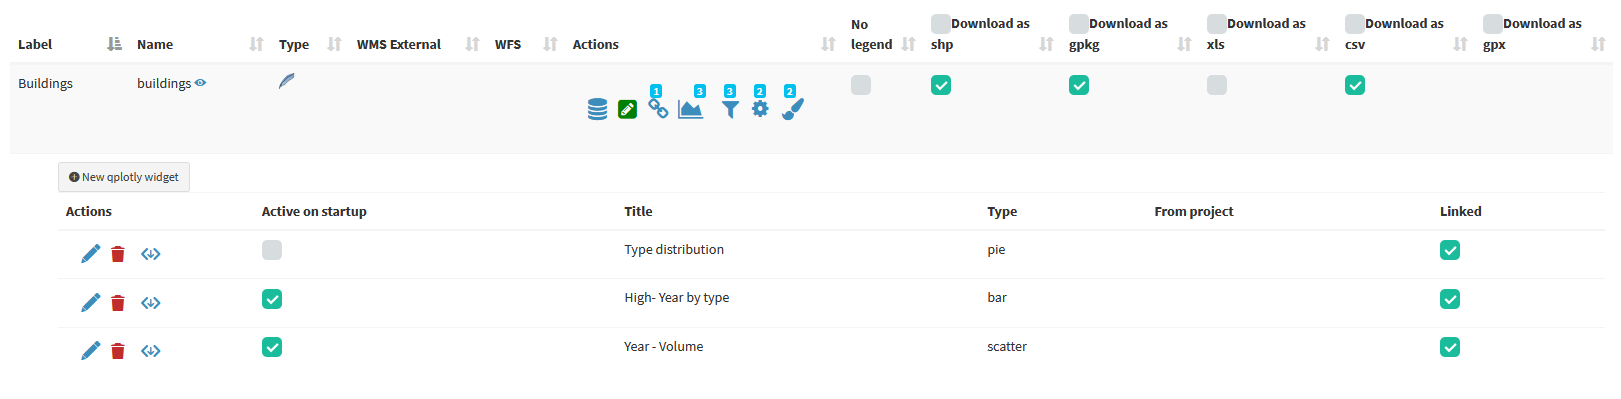
Download capabilities: allows the download of the geographic and not geographic layers in various formats
Download as shp/geotiff: for vector and raster layers
Download as GPK: for geographic or not geographic layers
Download as xls: for all types of layers, in .xls format
Download as csv: for all types of layers, in .csv format
Download as gpx: for geographic layers, in .gpx format
Download as PDF: for all types of layers, in .pdf format (limited to the attributes associated with individual features)
Visibility capabilities: allows you to define some elements in a generic way, i.e. without distinction between users.
Hide attributes table: make the attribute table unsearchable
Hide legend: do not show the associated legend
Hide Layer TOC: hide the layer in the TOC
The number above each Action icon shows if and how many related objects are present.
Try to activate the available options and test the result on the WebGis
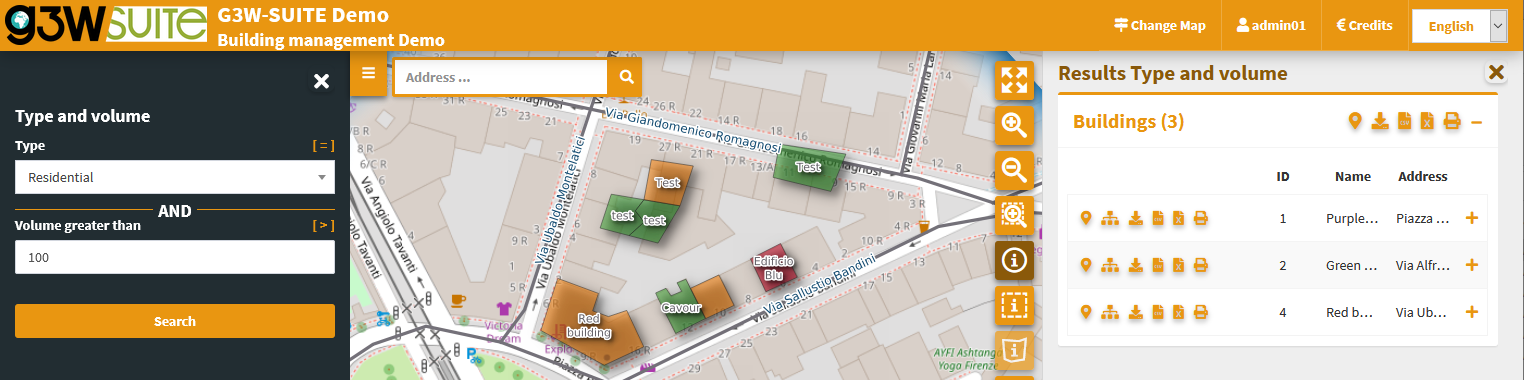
Search widget creation
To create a search tool available at WebGis level, choose the vector layer on which to apply the tool and click on the Widget list icon ![]()
NB: there may be a number of searches created by other users for the same layer.
You can activate them by clicking on the Linked chekbox.
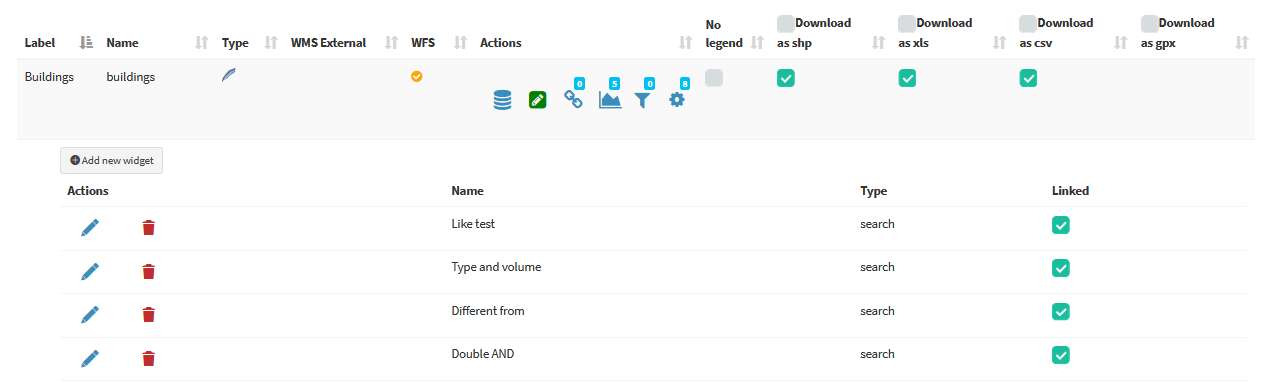
The listed searches can be modified, deleted or unlinked using the appropriate icons.
To create a new search, click on the blue link New widget.
In the related form we can define:
Form Title
Type: “Search”Name: name that G3W-SUITE will use to internally register the search widget.
General configuration of research and results
Search title: title that will become available in the ‘Research’ panel of the WebGis interfacePaginate results: option to activate pagination for the results list in order to avoid timeout problems in the case of a large number of results
Search fields settings
Field: field on which to carry out the researchWidget: method of entering the value to be searchedInputBox: manual compilationSelectBox: values shown via drop-down menuAutoCompleteBox: values shown through auto-complete modeDateTimeBox: widget to be used exclusively for date type fields. On the client, the user will define the date/time to search through the calendar/clock widget.
Alias: alias assigned to the field that will appear in the search formDescription: description assigned to the fieldComparison operator: comparison operator (=, <,>,> <,> =, <=, IN, LIKE, ILIKE) through which the search query will be carried out. The IN operator simplifies searches where a field must be associated with multiple values (OR operator)Use alternative unique values(for SelectBox widget): possibility to associate a layer of the QGIS project, that reports the list of the unique values to show in the search field. This greatly speeds up the loading times of the contents of the user-side search form, increasing the usability of the tool, especially in cases where there are numerous records with a small number of unique values.Dependency: this parameter (optional) allows, only in the case of SelectBox or AutoCompleteBox widgets, to show the list of values of a field filtered according to the value defined for the previous fields.
Now it is possible to define the dependence more or less strong (strictly).
In case of strictly dependence, the values of the dependent fields will be loaded only after the choice of the value of the field on which the dependency depends.
Otherwise it will be possible to define the values of the individual fields freely and without a specific order. The values available for the other fields will in any case depend on the choice made.
The button  allows you to add additional fields for the construction of the search query currently manageable through AND/OR operators.
The example below shows the compilation of the form for creating a search widget dedicated to a cadastral cartography layer.
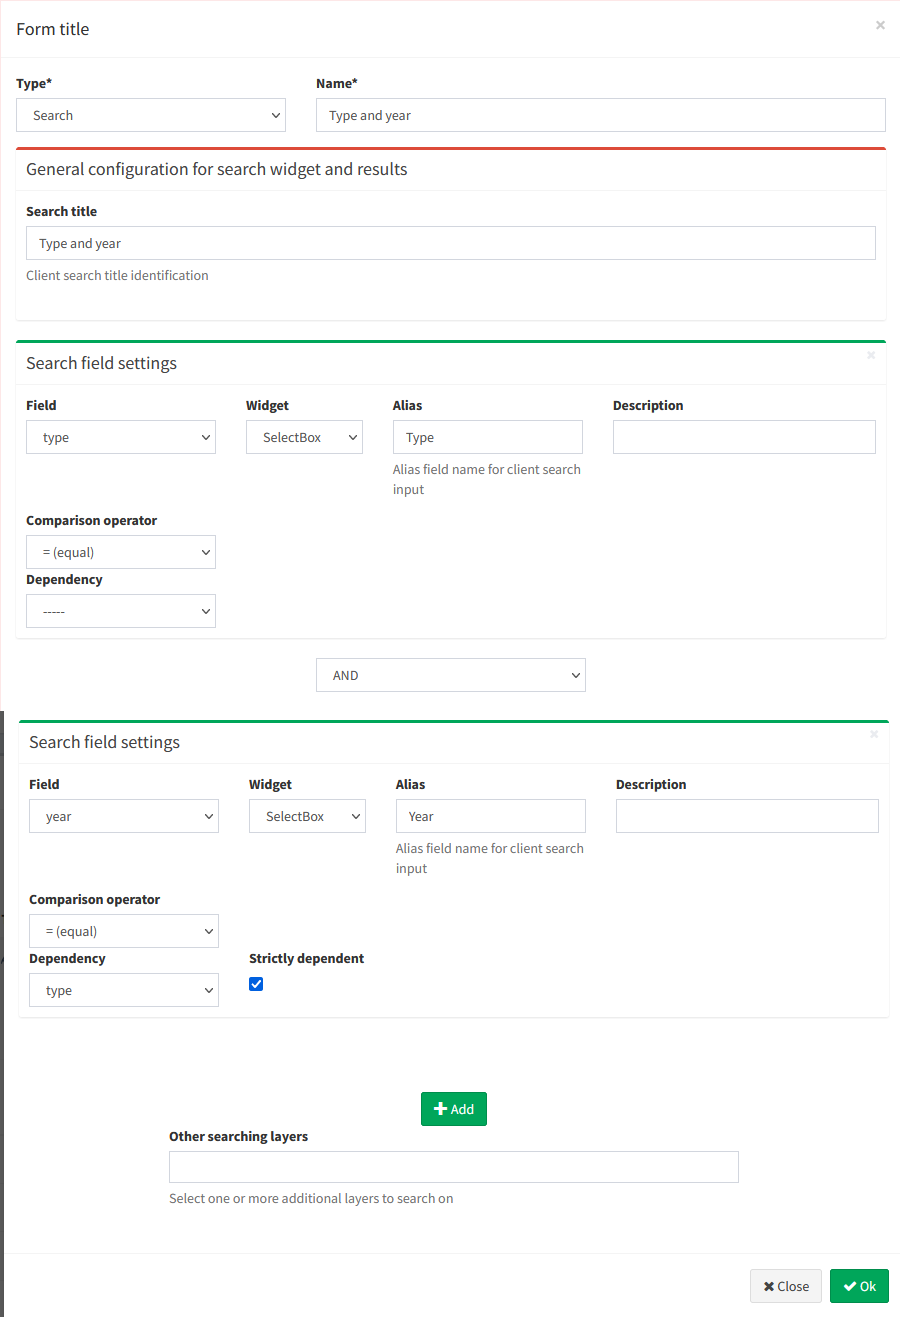
Once the form has been filled in, click on the OK button to save the settings.
Once the settings are saved, the created widget will appear in the list of Widgets associated with the layer.
The widget will already be linked and therefore available in the WebGis interface on the left panel.
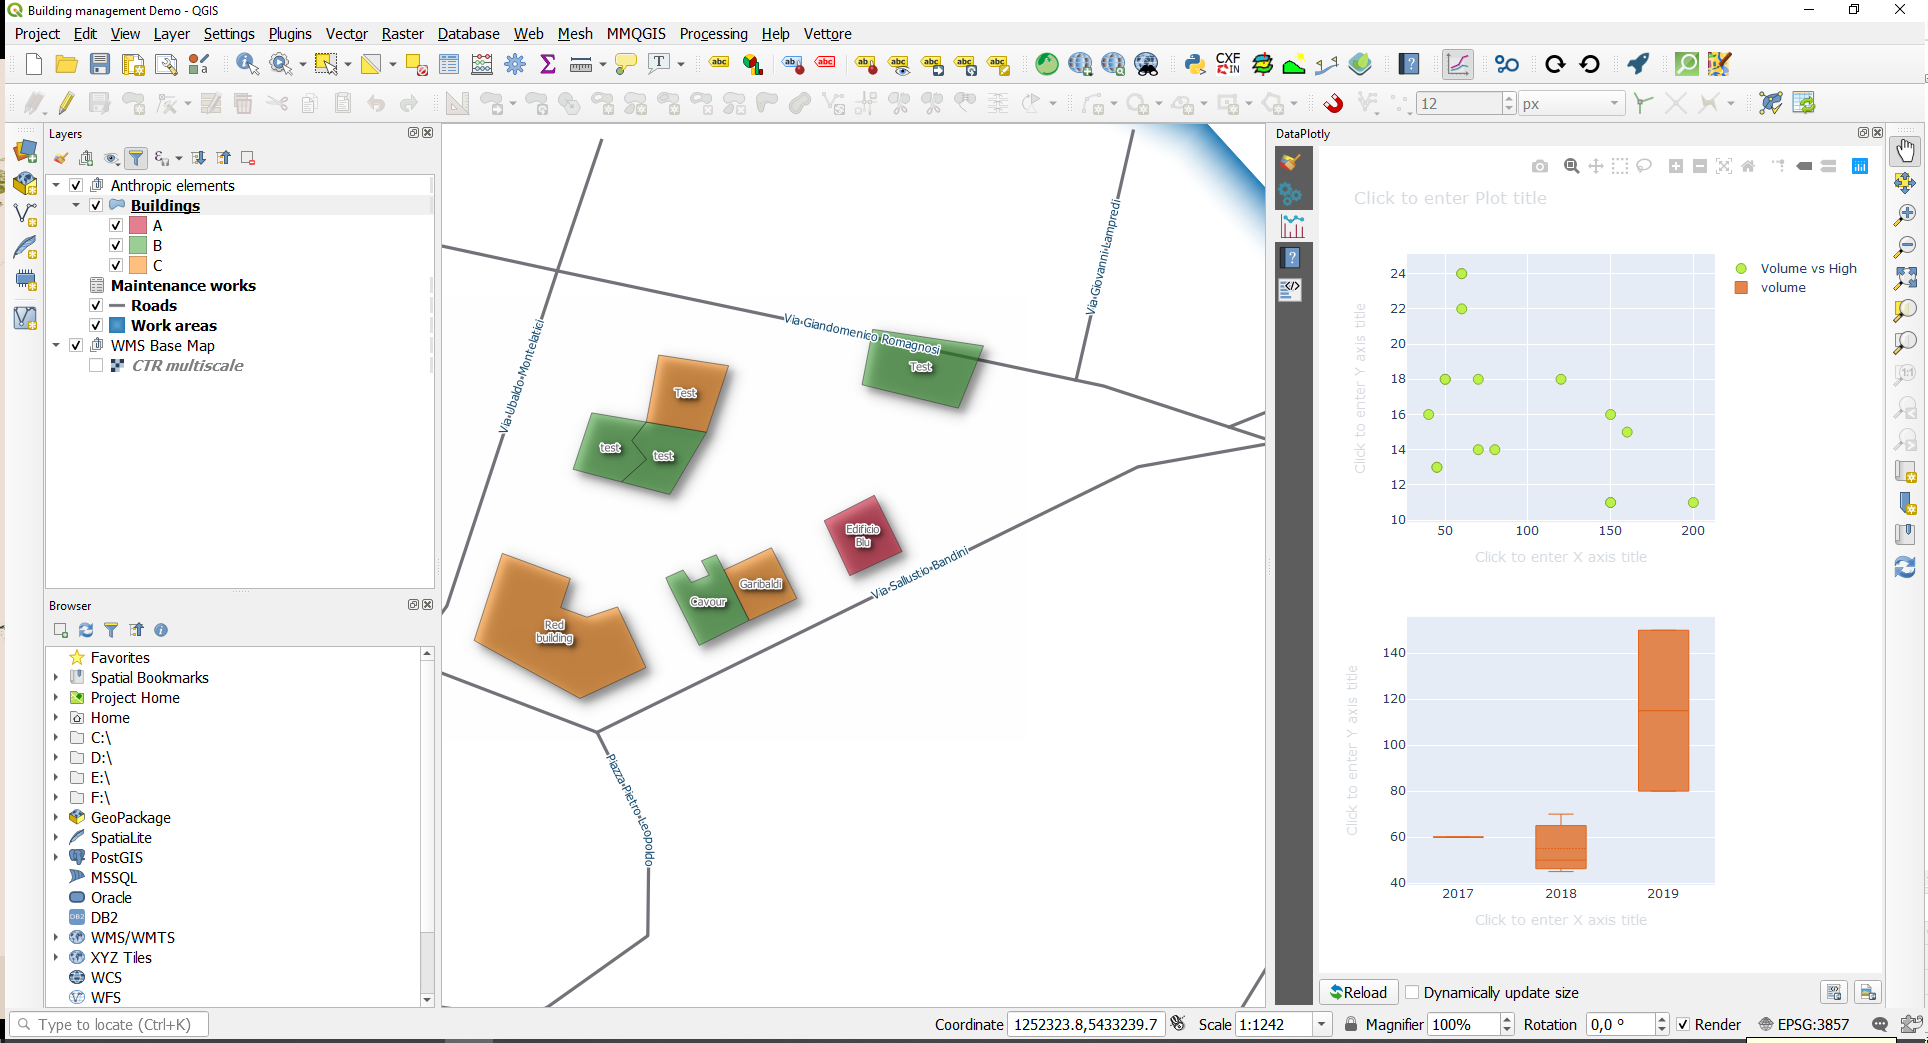
Plots widget
Add plots created using QGIS DataPlotly (a great plugin developed by Matteo Ghetta) in the cartographic client.
The module, based on the Plotly library, manages plots saved as xml.
The plots are connected to the layers defined on the QGIS project, in this way, as for the searches and the constraints, it is possible to activate the same plots on all WebGis services in which the reference layer is present.
For this reason, there may be some plots created by other users for the same layer.
You can activate them by clicking on the Linked chekbox.
The title of the chart, defined at the plugin level, will be the unique identifier.
Try to create your plots in the QGIS project, save them as .xml and upload them to view the resluts on the webgis.
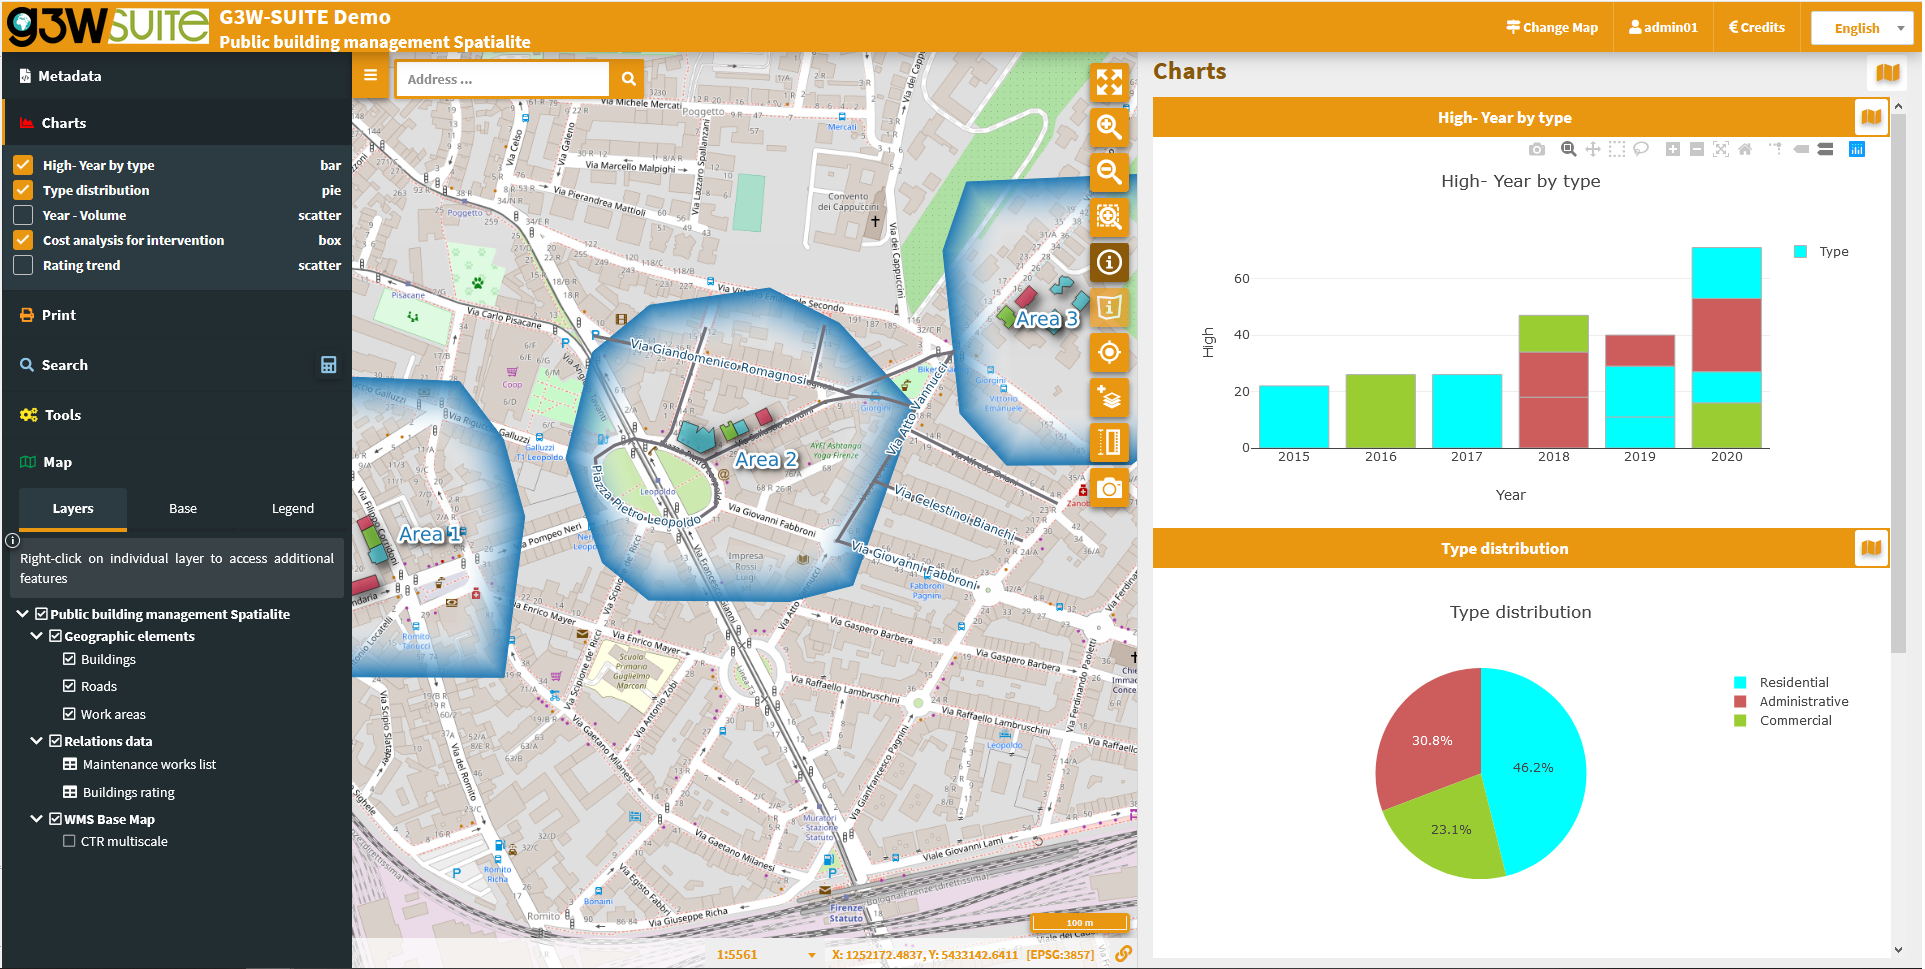
The graphs are filterable based on the:
 features visible on the map
 filter based on the selected features
These filters are also reflected on the plots associated to the related data (in 1:N mode) based on the visible and/or selected parent features.
The filter based on the map content can be activated globally on all plots (icon at the top of the panel dedicated to charts) or on only some specific plots (icon placed at the level of the individual plots).
The plots will automatically update after pan and zoom operations on the map
If activated, the filter based on the selected features is automatically activated on all related plots (associated with the same layer and with the 1:N relationed tables)
Appropriate messages at the single plots level will indicate the activation of these filters.
If 1: N relations are associated with the interrogated layer and plots have been activated on the referencing tables, it will also be possible to consult these plots by querying the referenced layer and clicking on the Show relation charts icon present in the results form.
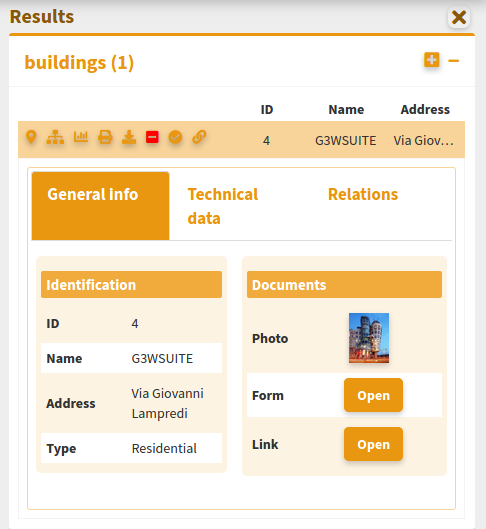
Show relation charts: display of graphs related to 1: N related data. Only if 1: N relations are associated with the interrogated layer and graphics have been activated on the boy tables.
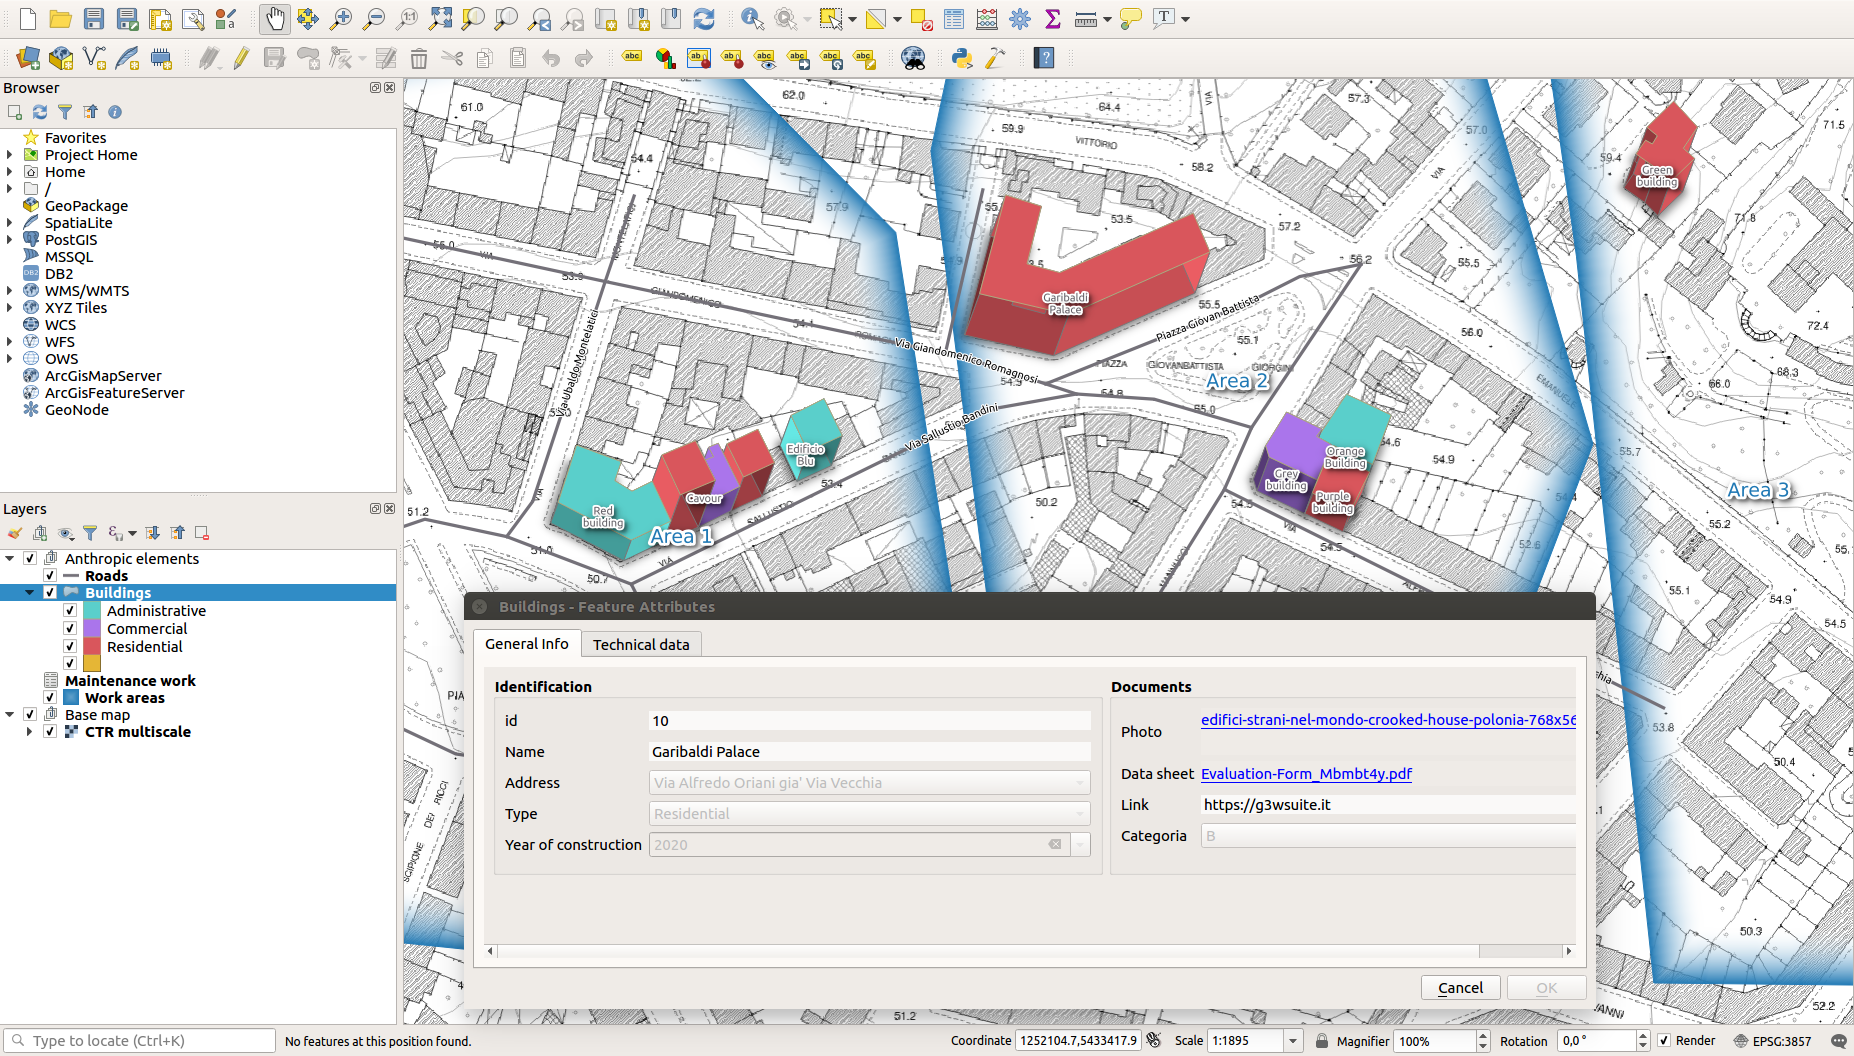
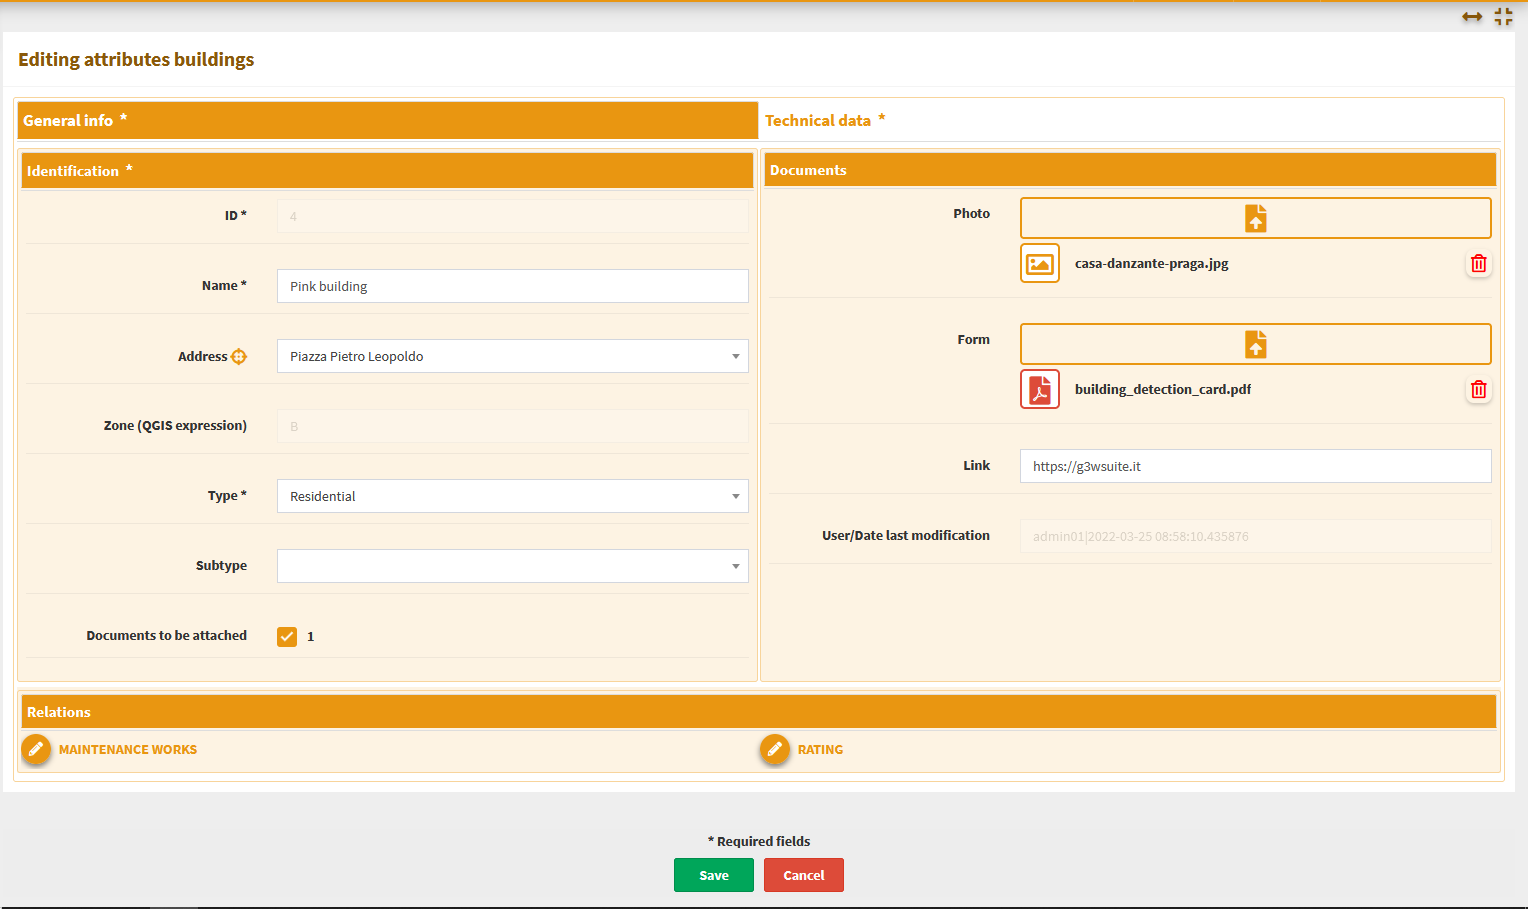
Editing on line
Forms and editing widgets are already defined on the project associated with the tutorial for the geometric layer of buildings and for the alphanumeric table related interventions_maintenance.
Buildingsid (integer - primary key): autogenerate
name (text NOT NULL): text edit
address (text): Value relation (roads layer - code/name fileds)
zone (text): text edit (with default values based on a QGIS expression to for association with the intersecting works area)
type (text NOT NULL): unique values (Administrative, Commercial, Residential)
subtype (text NOT NULL): value relation with multiple selections (based on type_subtype table for a drill-down cascading forms)
attachment (integer): check box 1/0 (the visibility of the conditional form Documents is based on this field)
photo (text): attachment
link (text): text edit
form (text): attachment
user (text): text edit (automatically filled in with the G3W-SUITE username creator of the feature)
year (integer NOT NULL): unique values (2015,2016,2017,2018,2019,2020)
high (integer NOT NULL): range (10-30 step 2)
volume (integer): range (50-200 step 10)
surface (integer): text edit
architectural_barriers (text): Checkbox (Checked - Not checked)
date_barriers (date): date (yyyy/MM/dd)
safety_exits (text): checkbox (Checked - Not checked)
date_exits (date): date (yyyy/MM/dd)
fire_system (text): Checkbox (Checked - Not checked)
date_fire (date): date (yyyy/MM/dd)
Maintenance_worksid (integer - primary key): autogenerate
id_buildings (text - relation key): text edit
maintenance (text NOT NULL): unique values
date (date): date (yyyy/MM/dd)
form (text): attachment
value (integer): range (10-30 step 2)
outcome (text): unique values (good, medium, bad)
responsible (text): text edit
cost (integer): range (1000-5000 step 1)
validation (boolean): checkbox (0/1)
Buildings ratingid (integer - primary key): autogenerate
id_buildings (text - relation key): text edit
date (date): date (yyyy/MM/dd)
value (integer): range (1000-4000 step 500)
year (integer): range (2018-2022 step 1)
To activate the editing function on webgis, access the list of layers and identify the three layers shown above.
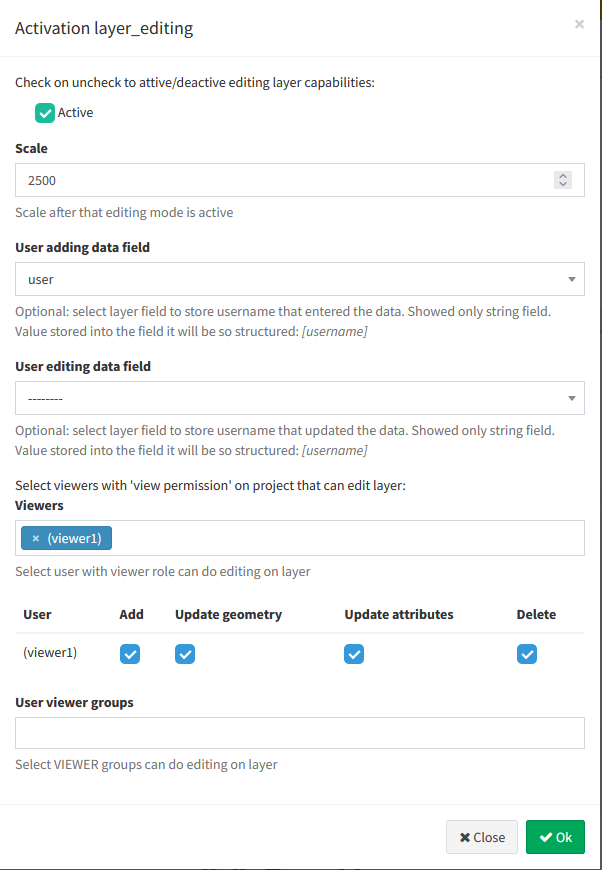
Clicking on the icon Editing layer ![]() (placed at the left of each rows) will open a modal window that will allow you to:
(placed at the left of each rows) will open a modal window that will allow you to:
define the
editing activation scale(only for geometric tables)define the
Viewer users(individuals or groups)enabledfor online editing
With regard to the last aspect, it should be noted that Viewers users (individuals or groups) available in the drop-down menu will be limited to those who have allowed access in consultation to the WebGis project
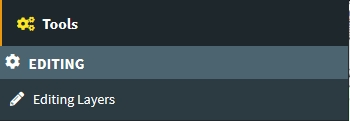
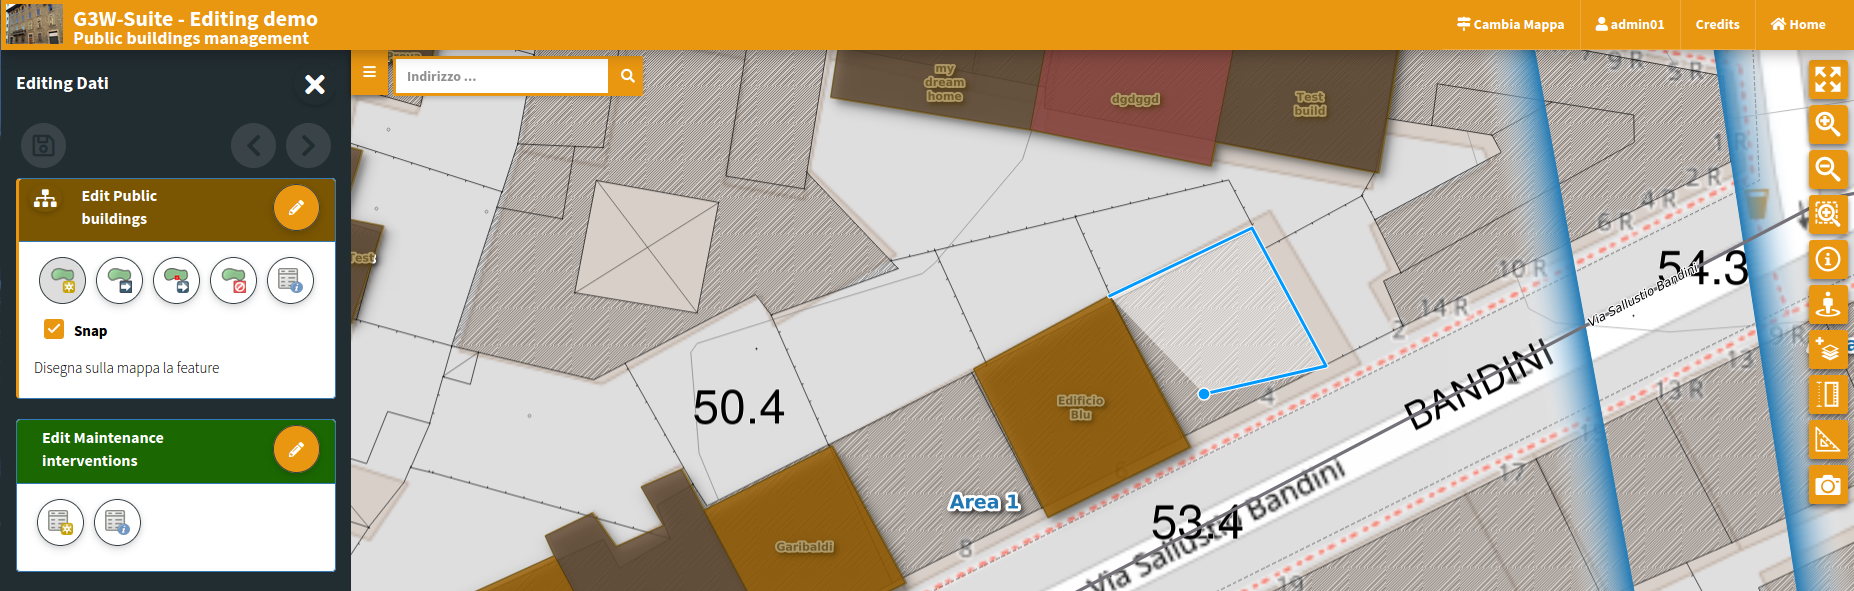
Once the editing function is activated, updating the service, the Tools menu will appear on the left panel.
By activating the editing function it will be possible to edit the geometries and attributes of the Public Buildings layer and the related interventions.
For further information on the web editing function, read the dedicated chapter on the manual
Personalize your demo
Do you want to test the online editing function more deeply?
Redefine attribute forms, aliases and editing widgets associated with the individual fields and reload the project to check the new settings.
It is advisable to consult the paragraph dedicated to the list and limitations of the individual editing widgets inheritable from the QGIS project.