G3W-ADMIN: the Administration panel
This section describes how to manage the various aspects and features of the Suite:
customization of the access portal
user creation and management (individuals and groups)
creation of MacroGroups and cartographic Groups and definition of access and management policies
publication of QGIS projects as WebGis services
updating and management of WebGis services (search tool and additional functions)
Description of the interface
The Administration Panel allows you to manage all aspects related to the publication of QGIS projects and configuration of related WebGis services
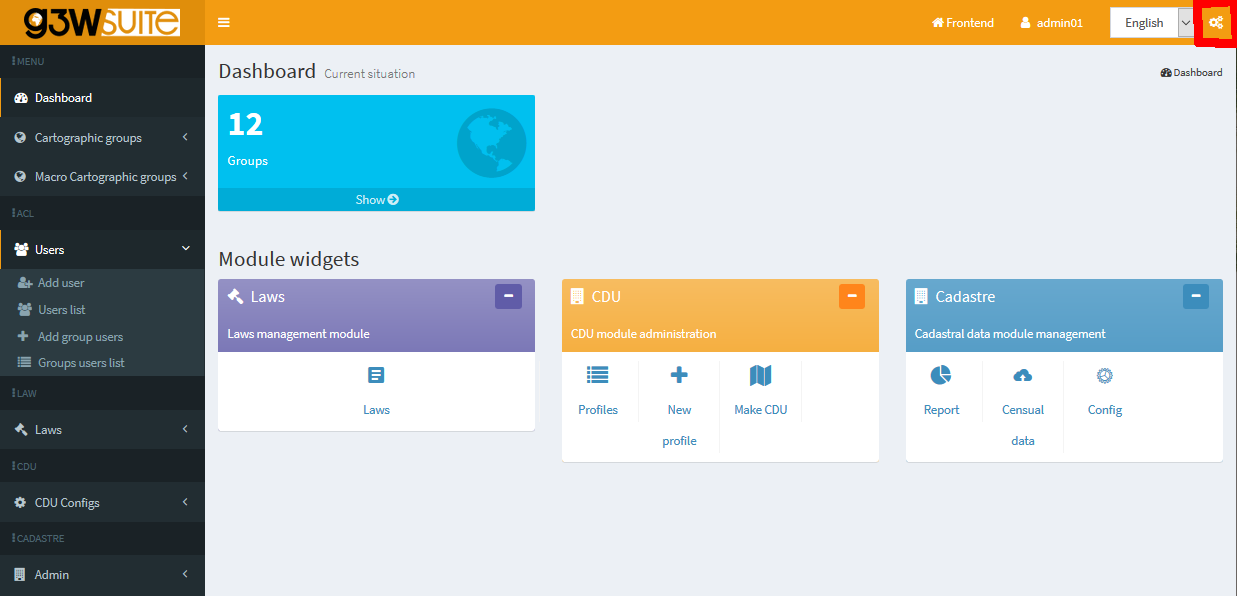
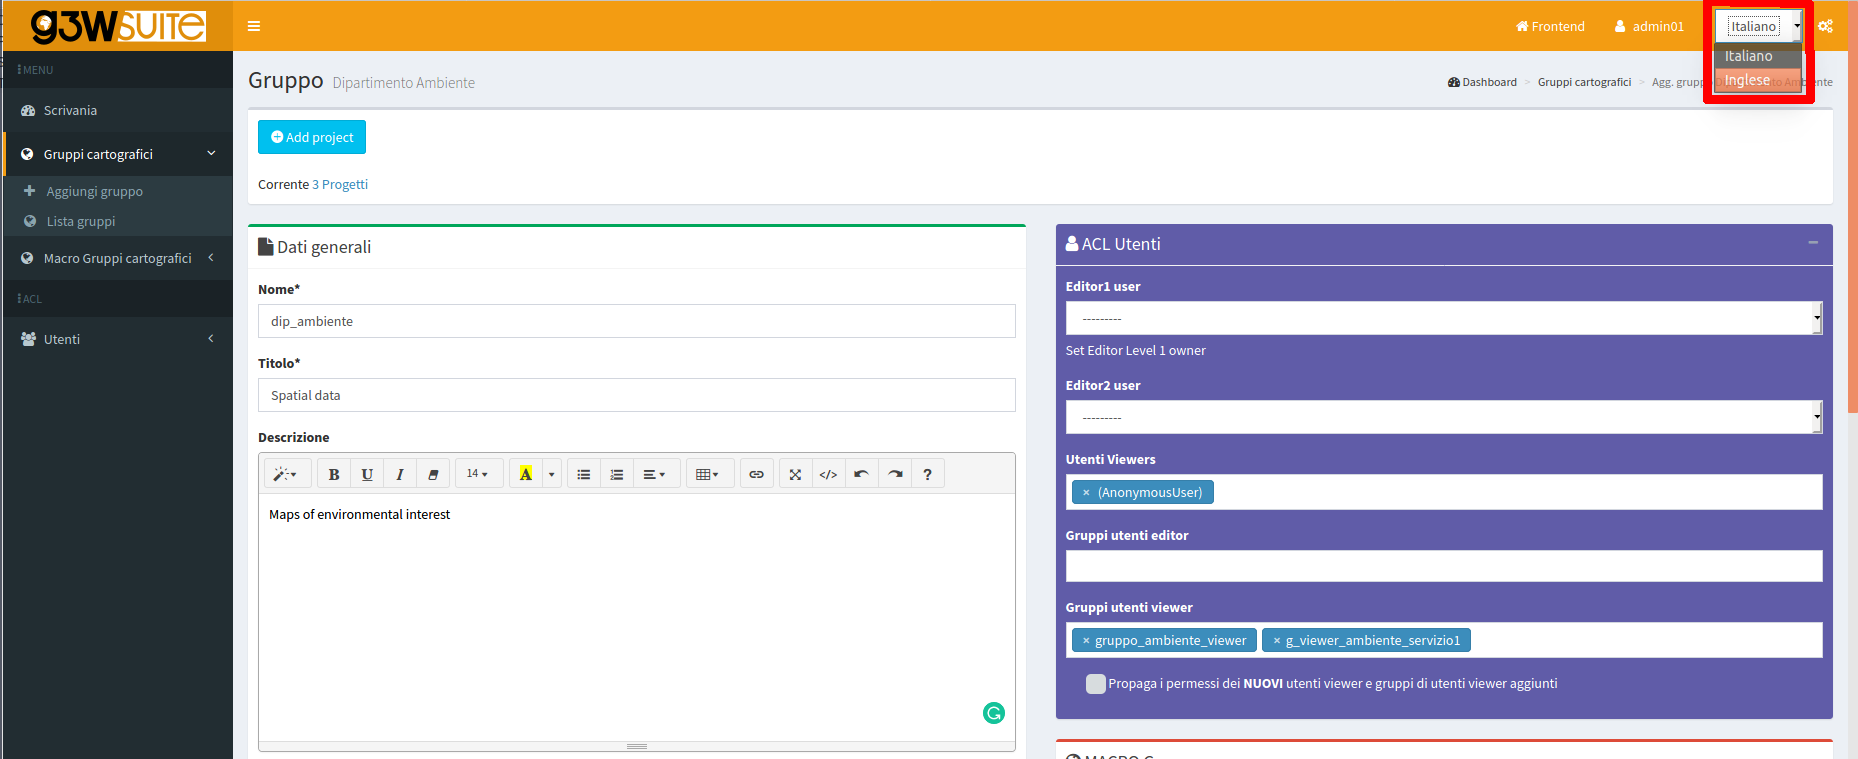
The main page of the Administration Panel shows:
a bar at the top:Frontend: to return the landing page portal
Username: to edit your profile and log out
Language: to choose the interface language
A gear icon
 : to access a menu with:
–> Edit general data: to set informations shown in the front-end portal
–> Django Administration (only for Admin01 user): to configure Django advanced settings
–> Files: to access the File Manager tool
a text menu on the left:Dashboard: Administration dashboard
Cartographic Groups: to create/manage cartographic groups
Macro Cartographic Groups: to create/manage Cartographic MacroGroups
Users: to create/manage single users and/or user groups
List of active modules: to activate/manage the functional modules active in your installation
a dashboard in the center of the pageDashboard: to access to list of Cartographic Groups
Module list: to access the respective settings
Front end portal customization
From the main page of the Administration Panel it is possible to customize the information shown on the Front End Portal.
Click on the Configurations icon located at the rigth bottom and choose the item Edit general data which will appear in the menu below.
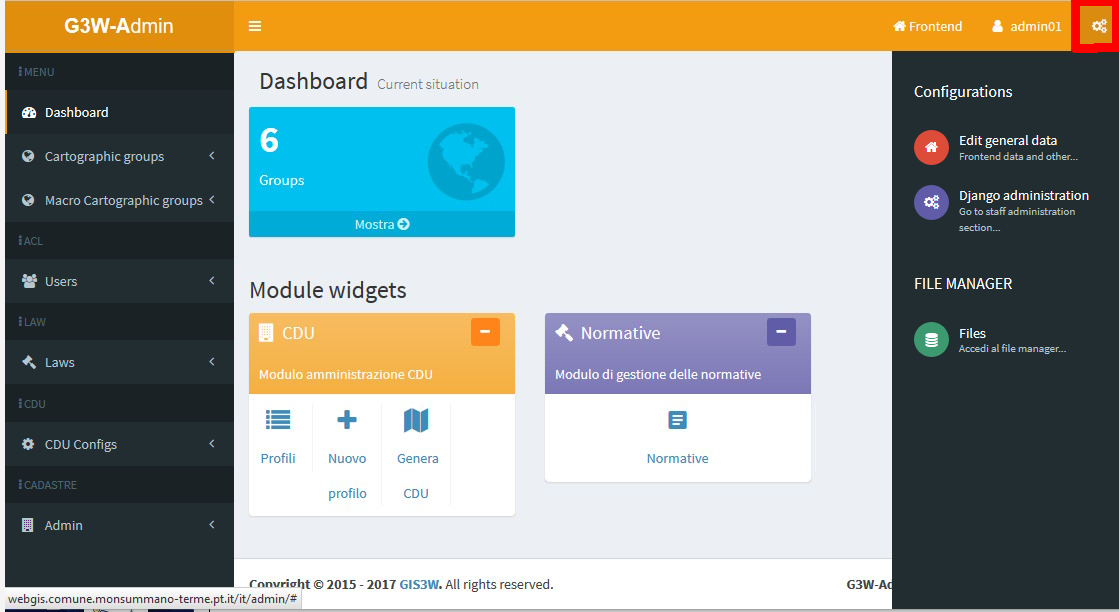
In the General suite data form you can define all the informations that will appear on the portal home page
Home data: info that will appear on the front end landing pageAbout data: info that will appear in the About it sessionGroup map data: info that will appear in the Maps sessionLogin data: info that will appear in the Login/Administration sessionSocial media data: links to the social channels that will appear in the About it it sessionMap Client data: main title to be displayed in the cartographic client bar
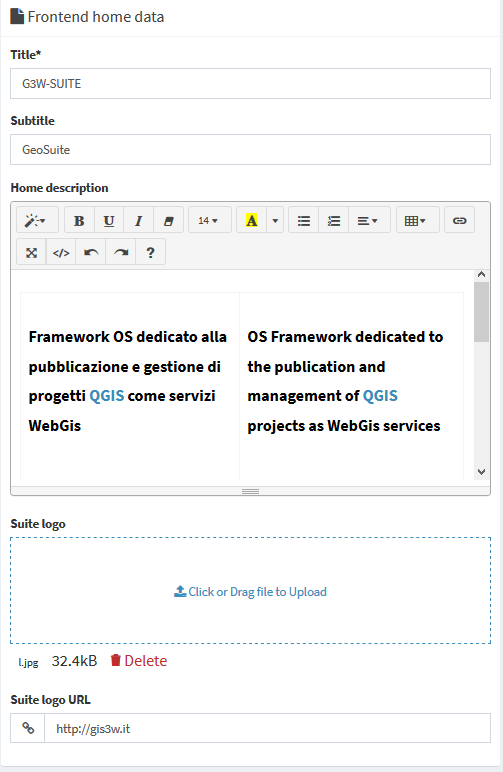
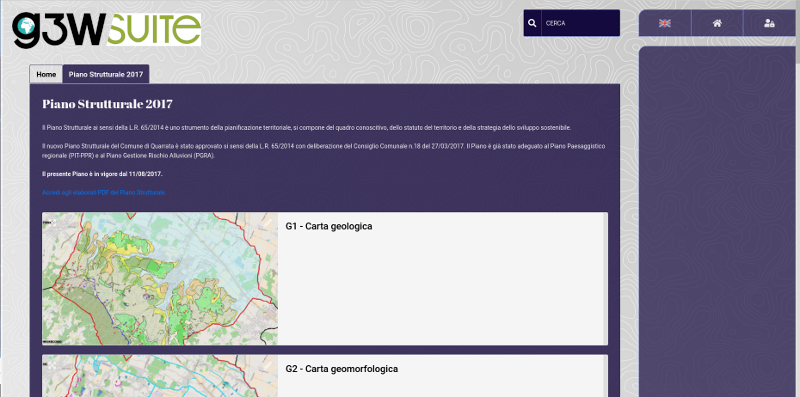
Front End Home Data
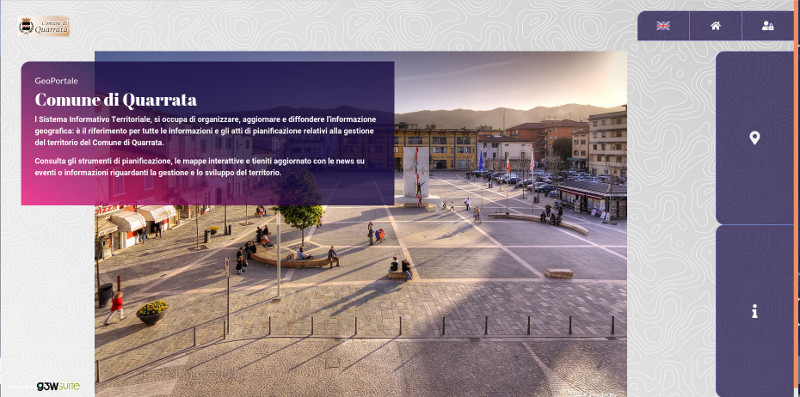
Informations that will appear on the front end landing page
ATTENTION: contents marked with * are mandatory.
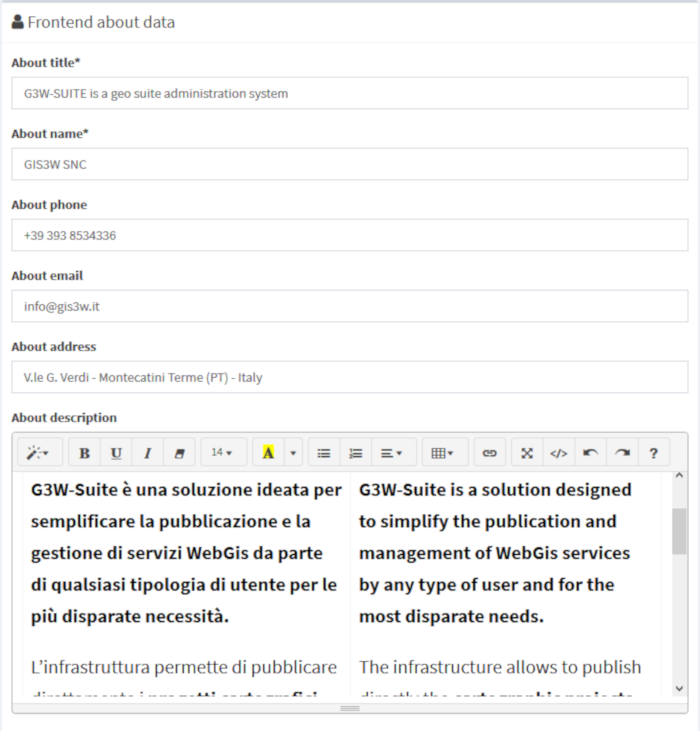
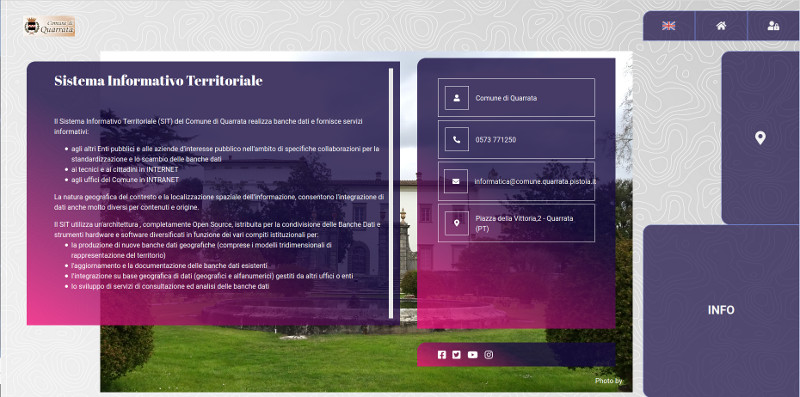
Front End About Data
Informations that will appear in the Info session
ATTENTION: contents marked with * are mandatory.
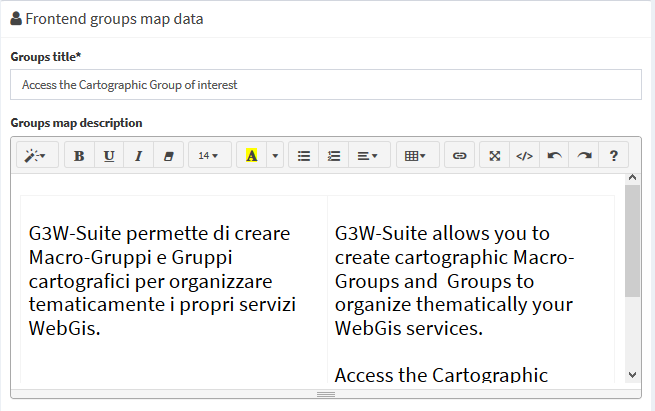
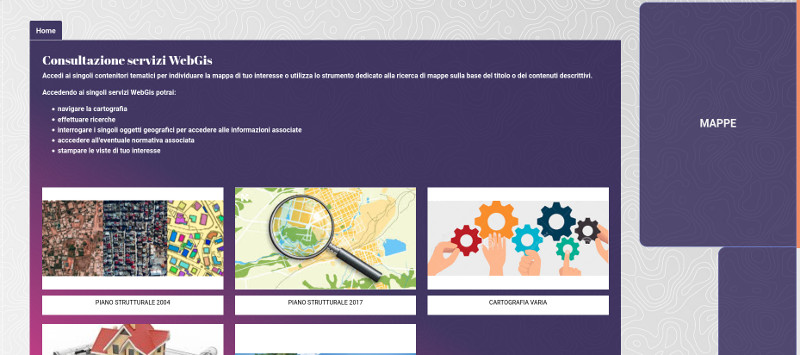
Frontend Groups Map Data
Information that will be displayed in the Maps session
ATTENTION: contents marked with * are mandatory.
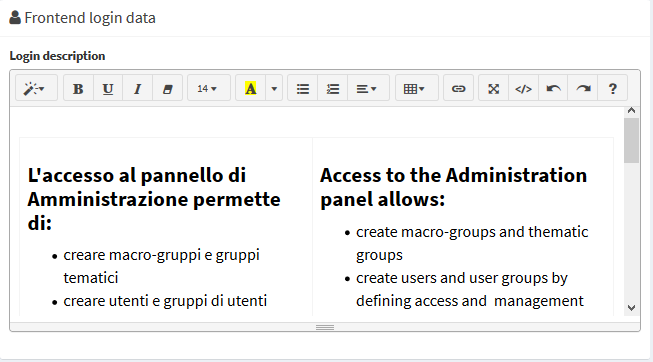
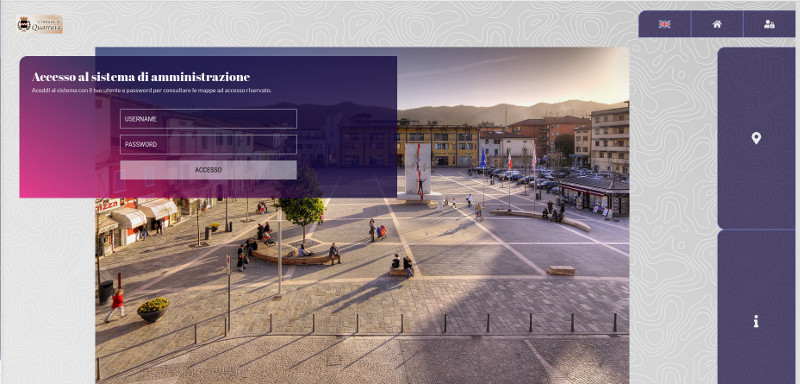
Front End Login Data
Information that will be displayed in the Login/Administration session
ATTENTION: contents marked with * are mandatory.
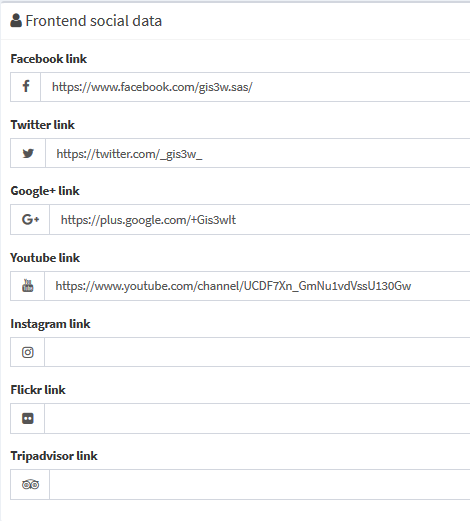
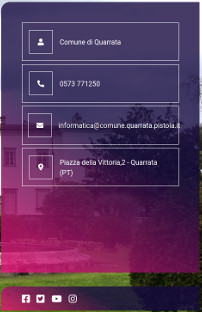
Front End Social Data
Links to the social channels that will be displayed in the About it it session
ATTENTION: contents marked with * are mandatory.
Map client data
Main title to be displayed in the cartographic client bar
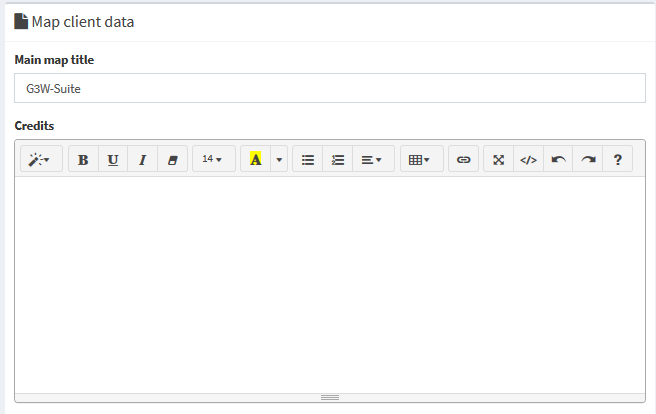

In the Credits subsection it is possible to define additional text for the publishing aspects.
After filling in the various form, click on the Save button to confirm your choices.

Users and Users Groups management
In the left side menu there is the Users item with four sub-items:
Add user
Users list
Add groups users
Groups users list
Please note that the Suite is equipped with a dedicated module for the integration of Active Directory users via LDAP.
Add user
Through this form it is possible to insert new users and define their characteristics.
Anagraphic: first name, last name and email addressLogin: username and passwordUser backendACL/RolesSuperuser status (Admin1 and Admin2 users only)
Staff status: deep administration of the application (Admin1 users only)
Main roles (Editor1, Editor2 or Viewer)
User Editor groups: any Editor2 user group they belong to
User Viewer groups: any Viewer user group they belong to
User data:Departments and image to be associated with the profile
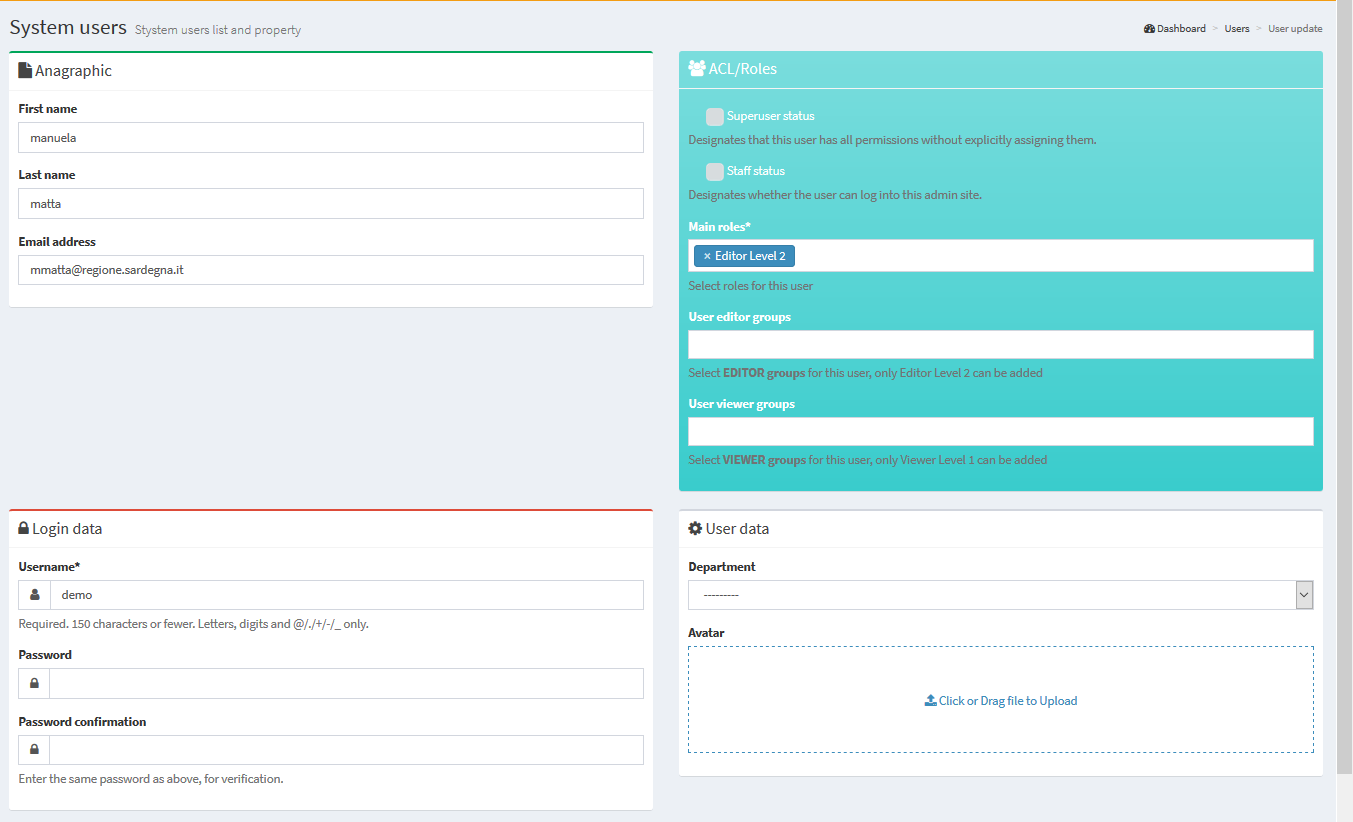
After filling in the various form, click on the Save button to confirm your choices.
Users list
Through this form you can consult the list of enabled users and their characteristics:
Username
Roles
User groups to which they belong
Associated Cartographic MacroGroups (only for Editor1 users)
Super user and/or Staff privileges
Email, name and surname
Creation date
Info on user creation (G3W-SUITE or LDAP)
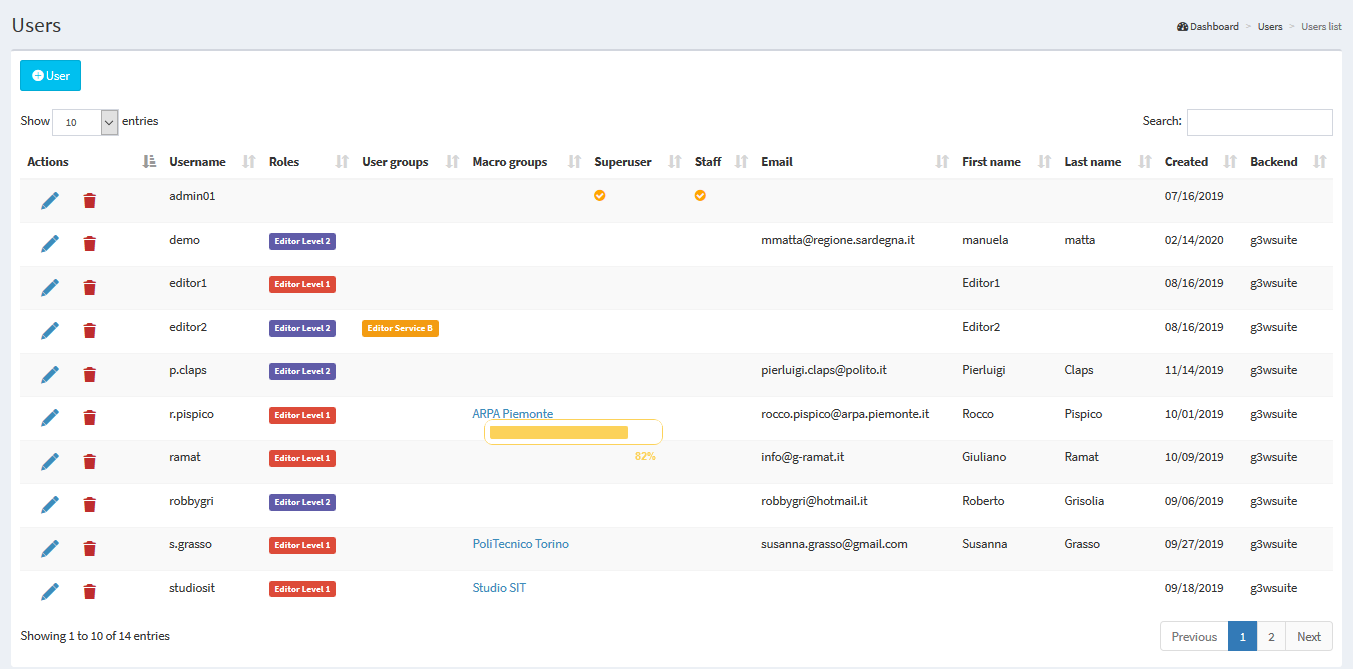
The icons at the head of each row, allow you to:
 Modify: to modify the characteristics of the user
 Delete: to permanently delete a user
Add Group Users
Through this form it is possible to insert new user groups and define their role.
It is possible to create only two types of user groups:
Editor: in which only Editor2 users can be insertedViewer: in which only Viewer users can be inserted
The association between user and user groups is made at the individual user management level.
In the specific form for creating user groups, the following info are defined:
Name
Role (Editor or Viewer)
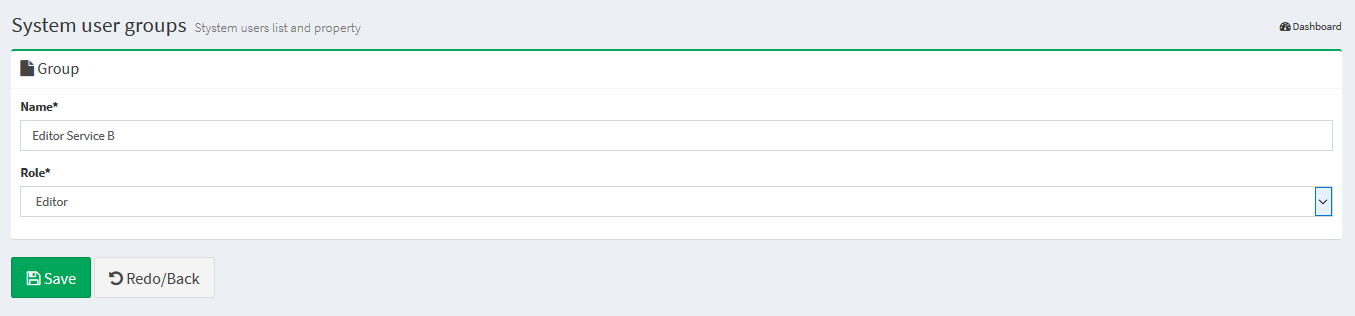
After filling in the from, click on the Save button to confirm your choices.
Groups users list
Through this form it is possible to consult the list of enabled user groups, their characteristics and the individual users belonging to the group.
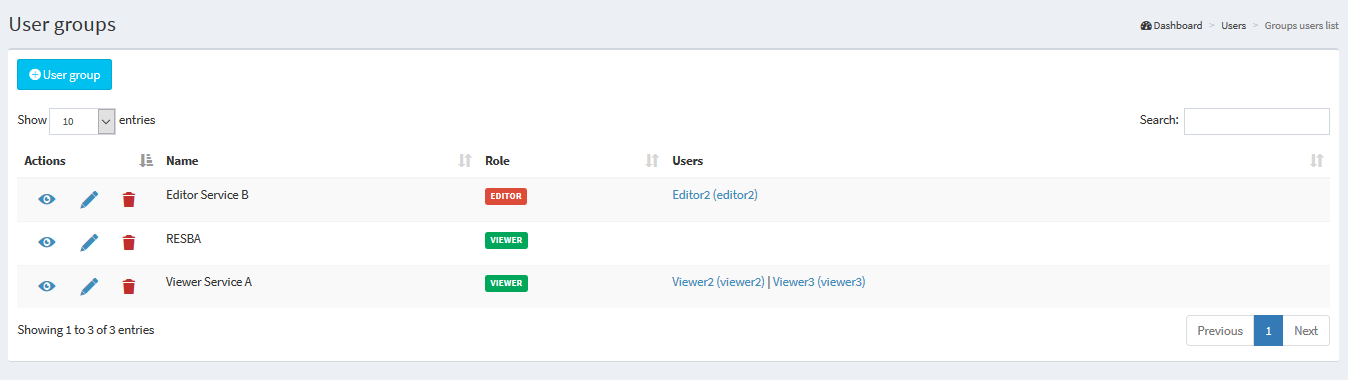
Using the icons at the head of each row, you can:
 Show details: to consult the characteristics of the user group
- Modify: to modify the characteristics of the group
- Delete: to permanently delete a group and therefore association with users belonging to the group itself
Macro Cartographic Groups
In this section it is possible to view the list of Cartographic Macrogroups, manage them and create new ones.
ATTENTION: use the Cartographic MacroGroups only if you need them.
See chapter Hierarchical organization of WebGis services and types of Users to learn more about this aspect.
For example, you can create a Macrogroup to collect a series of Cartographic Groups belonging to the same Administration (single Municipality within a Union of Municipalities) or more simply to have main containers that contain second level groupings (Groups).
In the left side menu there is the MacroGroup Cartographic item with two sub-items:
Add MacroGroups: to create a new Cartographic MacroGroup
MacroGroups list: to access the list of MacroGroups present
Add MacroGroups
Through this item, available only for the Admin users, it will be possible to create a new Cartographic MacroGroup and associate it with an Editor1 type user who will become its administrator.
Let’s see in detail the various sub-sessions of the group creation form.
ACL users
Editor users: you define the Editor1 user who will become the MacroGroup administrator. This user will can manage the MacroGroup by creating Cartographic Groups, publishing projects and creating Users or User Groups.
General data
Identification name *: a generic internal identification name (not show in the front end)Title *: descriptive title of the MacroGroup (will appear in the list of MacroGroups) and, eventually, in the client headerUse title for client option
Use logo image for client option
Description: the description to be associated with the MacroGroup in the frontendLogo img*: the logo to be associated with the MacroGroup in the frontend and, eventually, in the client header
By default, the map client header, for each WebGis service, is composed of:
main title (if set at General Data management level)
logo and title associated with the Cartographic Group
title of the WebGis service
If you select the Use MacroGroup title and logo for the client options, the map client header, for each WebGis service, will instead consist of:
main title (if set at General Data management level)
logo and title associated with the Cartographic MacroGroup
title of the WebGis service
After compiling the form, click on the Save button to confirm your choices.
MacroGroups list
The menu provides access to the list of cartographic macro-groups present.
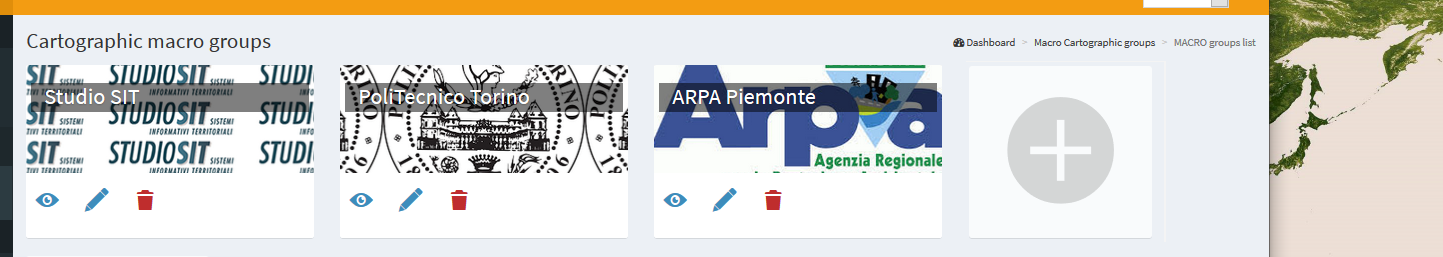
There are a series of icons to access specific functions:
- Show the details of the MacroGroup
- Change characteristics of the MacroGroup
- Delete MacroGroup
ATTENTION: the removal of the Cartographic MacroGroup group will result in:
the removal of all the Cartoghraphic Groups contained in it
the removal of all the cartographic projects contained in the individual Groups
the removal of all the widgets (eg searches) that would remain orphaned after the removal of the cartographic projects contained in the group. See the Widget chapter for more information.
Define the MacroGroups order on the FrontEnd
Through the Drag & Drop function it is possible to define the order of the MacroGroups in the list. This order will be reflected in the FronEnd.
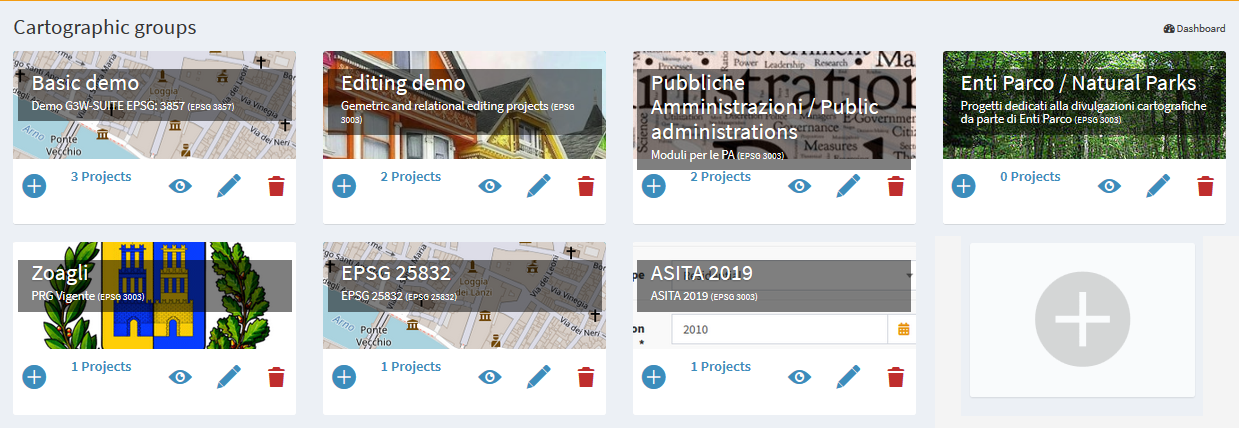
Cartographic Groups
In this section it is possible to view the list of Cartographic Groups present, manage them and create new ones.
A Cartographic Group is create to collect a series of cartographic projects belonging, for example, to the same theme (Urban Planning Regulations, tourist maps …) and characterized by the same projection system.
It should be remembered that it will be possible to switch from one webgis service to another, leaving the same geographical extension and scale, only between the projects contained in the same cartographic group.
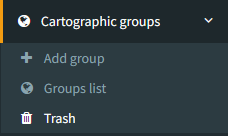
In the left side menu there is the Cartographic Groups item with two sub-items:
Add Group: to create a new Cartographic Group
Group List: to access the list of groups present
You can also access the list of groups by clicking on the “Show” button in the Cartographic Groups box on the Dashboard.
Add Group
Through this item it is possible to create a new Cartographic Group.
During creation, some functional characteristics and tools that the WebGis interface will show for all cartographic projects published within the group are also defined.
Let’s see in detail the various sub-sessions of the group creation form.
General data
Name *: a generic internal identification name (not show in the front end)Title*: descriptive title of the Group (will appear in the list of Cartographic Groups)Description: description of the contentLanguage*: interface language
Logo/Picture
Header logo img*: the logo to be displayed in the header del client cartograficoUse logo image for clientoptionLogo link: a eventual link to associate with the logo
REMEBER
By default, the map client header, for each WebGis service, is composed of:
main title (if set at General Data management level)
logo and title associated with the Cartographic Group
title of the WebGis service
If you select the Use MacroGroup title and logo for the client options, the map client header, for each WebGis service, will instead consist of:
main title (if set at General Data management level)
logo and title associated with the Cartographic MacroGroup
title of the WebGis service
If you select the Use Group logo for the client options, the map client header, for each WebGis service, will instead consist of:
main title (if set at General Data management level)
title associated with the Cartographic MacroGroup
logo associated with the Cartographic Group (if MacroGroup logo option is active this options takes precendence)
title of the WebGis service
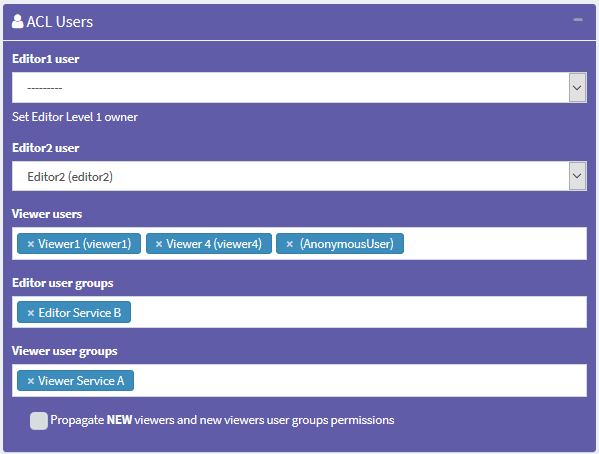
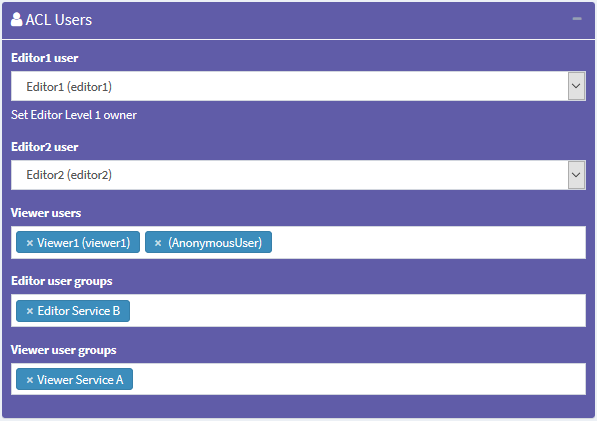
ACL Users
Access and modification powers are managed.
The options present will vary according to the type of user (Admin or Editor1) who creates/manages the Group
Editor1 User: defines the user (Editor1) manager of the Group. The entry is present only when the Admin type user creates the Group If the Group is created by a user of type Editor1, the Group is associated directly with that userEditor2 User: defines the user (Editor2) manager of the Group.Viewers users: define the individual users (Viewers) who have the credentials to view the contents of the group. By choosing the anonymous user (AnonymusUser) the group will be free to accessEditor user groups: define the user groups (Editor2) who manage the Group.Viewer user groups: you define the user groups (Viewer) which have the credentials to view the contents of the group.
The option Propagate viewers user (single and groups) permissions allows you to propagate the Viewer users (individuals and/or groups) associated to the Group to ALL the WebGis services present in it.
This option cancels any differentiation in the access policies applied to the WebGis services contained in the Group.
MacroGroups
Possible definition of the belonging MacroGroup.
This option is available only if Cartographic macro groups have been created
In the event that the Group is created by an Editor1 type user, the Group will be automatically associated with the MacroGroup associated with the same Editor1.
GEO data
Projection system associated with the group.
N.B. All projects loaded into the group must be associated with this SRID.
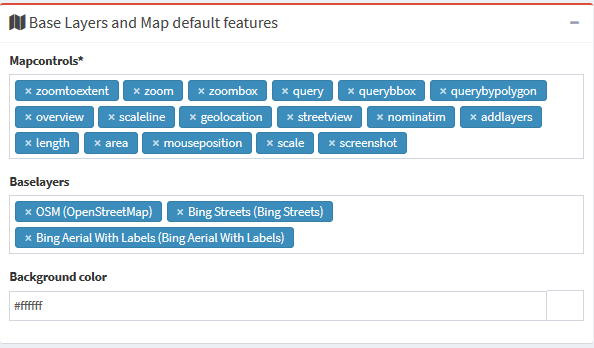
Base layers and Map interaction tools
In this box you can define:
Mapcontrols*: list of tools available on the WebGis client:zoomtoextent: zoom to the initial extension
zoom: zoom in and zoom out
zoombox: zoom tool based on drawing a rectangle
query: puntual query of geographical layers
querybbox: query via bounding box (N.B. it is necessary that the layers are published as WFS services on the QGIS project)
querybypolygon: it will be possible to automatically query the features of one or more layers that fall inside a polygonal element of a guide layer. (Eg what’s inside a cadastral parcel?) - N.B. it is necessary that the all the layers involved in this kind of query are published as WFS services on the QGIS project
querybydrawpolygon: query based on a polygon drawn on the map (N.B. it is necessary that the layers are published as WFS services on the QGIS project)
zoomhistory: undo/redo tools to navigate previous and post visualization areas
overview: presence of a panoramic map
scaleline: presence of the scale bar
scale: tool for defining the display scale
mouseposition: display of mouse position coordinates
geolocation: geolocation tool (available only with https certificate)
nominatin: address search tools and toponyms based on OSM
streetview: Google StreetView on your map
in the presence of GoogleMaps API Key, StreetView it is integrated on the client and synchronized with the position and direction of the icon on the map
in the absence of GoogleMaps API Key, StreetView it will open on a new browse tab without the aspects of synchronization with the map
length: linear measuring instrument
area: surface measuring instrument
addlayers: tool for temporarily uploading GML, GeoJson, KML, GPX, SHP (zipped) and CSV with coordinate to WebGis. These layers will remain until the end of the work session
screenshot:* tool to take a screenshot of the map area
GeoScreenshot:* tool to create a GeoTIFF of the map area
Baselayer: choice of the base maps that will be available on the WebGis clientBackground color: choice of the background color of the maps (default white)
*NB: the security protocols prevent the creation of screenshots if WMS services with domains other than the publication one are present on the map. In this case the icons will not be present on the client even if the MapControl is selected. To avoid this, set the WMS as internal WMS in the Widget managment session.
With regard to the Base Layers, it is specified that the external services available by default are:
OSM
It is also possible to add Bing and Google maps to the Base Layers but it is first necessary to acquire the respective API Keys and set them in the Django settings level.
Remember that it is possible to build customized Base Layers starting from projects published on the suite.
In this regard, consult the session Base map layer
It is possible to create/add customized Base Layers starting from the cache of the single layers present in published webgis
See Caching layer paragraph in the Widget management session.
Copyrigth
Terms of use: description of the terms of use of the map and any other info
Link to terms: link to text
After filling in the various form, click on the Save button to confirm your choices.
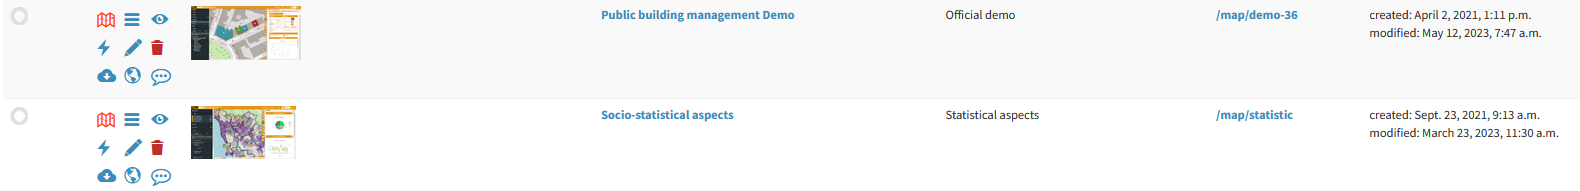
Groups List
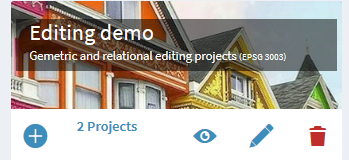
From this item you can access the list of the created cartographic groups.
For each group, the Title and Subtitle defined at the time of creation are shown.
There are also a series of icons to access specific functions:
 Add a new project to be published on the WebGis service
Number and links to projects published within the Group
- Show group details
- Change group characteristics
- Delete group
ATTENTION: the removal of the cartographic group will involve:
the removal of all the WebGis services contained therein
the removal of all widgets (eg searches) that would be orphaned after the removal of the WebGis services contained in the group. See the Widget chapter for more information.
A large + icon is available to access the form for creating a new group.
Cartographic Group Trash
The operation of deleting a Cartographic Group is not definitive.
The Group with all its related content (projects and widgets) is moved to the Trash session.
It is possible to access the list of trashed.
Cartographic Groups and the restore functions through the menu on the left sidebar.
Restoring a Cartographic Group involves restoring all the projects it contains and all the accessory settings/functions of both the group and the projects (permissions, searches, editing settings, downloads, etc…).
Deleting a Cartographic Group from the trash is an irreversible action.
Define the Groups order on the FrontEnd
Using the Drag & Drop function it is possible to define the order of the Groups in the list.
This order will be reflected within the belonging MacroGroups.
NB: currently in the list of Groups it is not present in the subdivision in the belonging MacroGroups but the fact that a Group can be associated with only one MacroGroup still allows you to manage intuitively what will be the complessive display order.
Publication of new WebGis services
To publish a new QGIS cartographic project
It is possible to publish new QGIS projects:
from the list of cartographic groups: click on the icon
located under the box of the cartographic group in which you want to publish the project.from the list of cartographic projects published within a group: by clicking on the the buttom

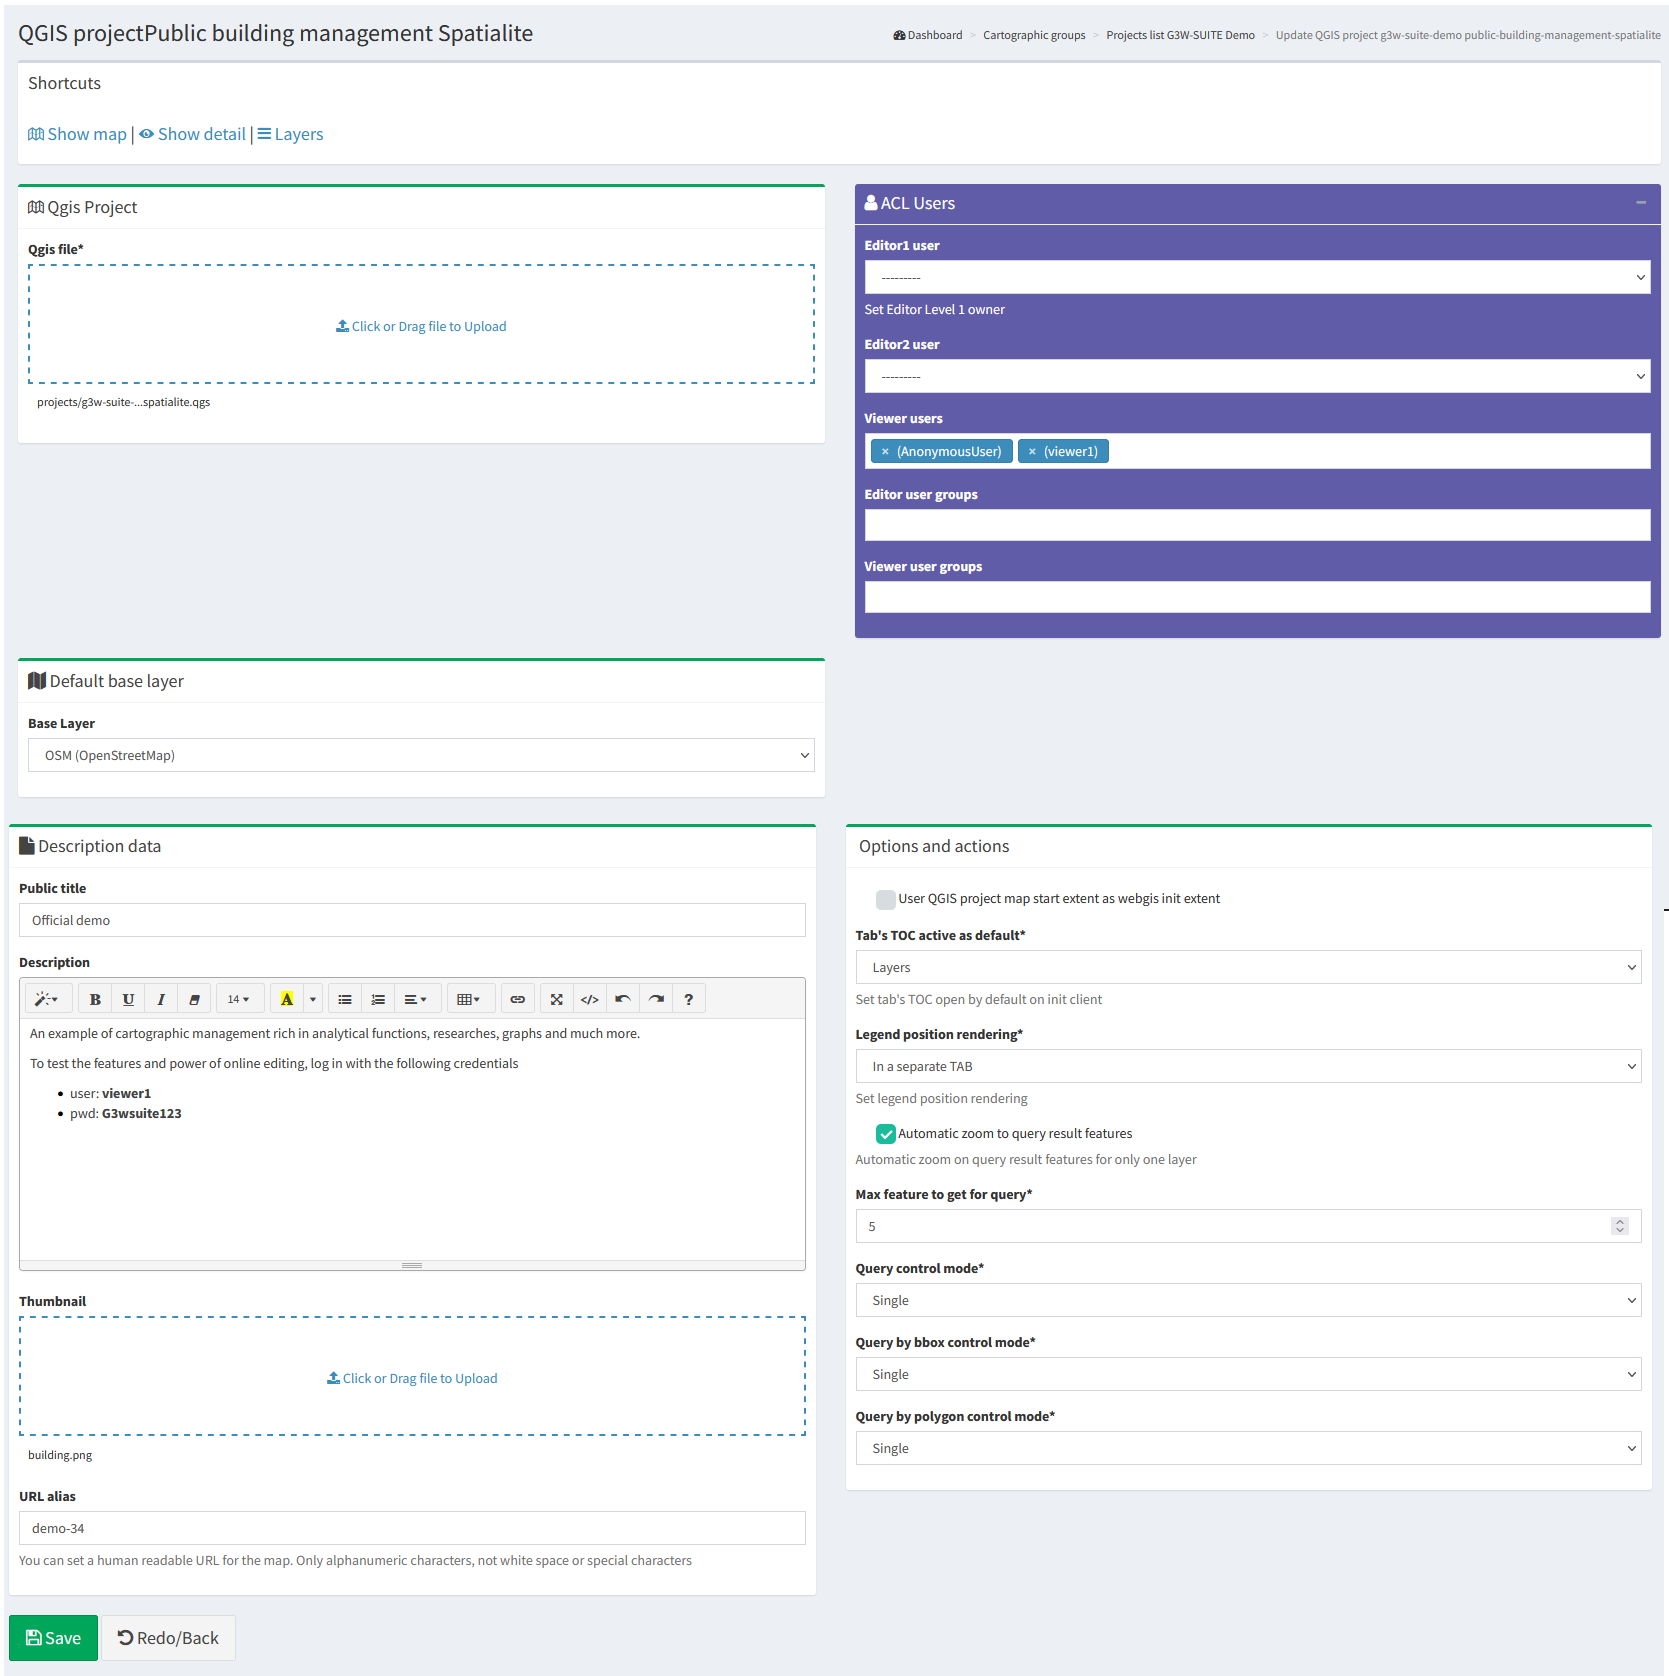
In the dedicated form we could define the charatteristicsof the project being published:
QGIS project
QGIS file*: load the QGIS cartographic project to be published (.qgz or .qgs file)
ACL Users
Management of access and/or modification permissions
The options present will vary according to the type of user (Admin, Editor1 or Editor2) who creates / manages the WebGis service.
Editor1 user: defines the user (Editor1) manager of the WebGis service.
The entry is present only when the WebGis service is created by Admin or Editor1 user.
In the event that the WebGis service is published by a user of type Editor1, the WebGis service is associated directly with that user
Editor2 User: defines the user (Editor2) manager of the WebGis service.The item is present only when the user of the Admin or Editor1 type creates the service WebGis. In the event that the WebGis service is published by a user of type Editor2, the WebGis service is associated directly with that user
Viewers users: define the individual users (Viewers) who have the credentials to view the WebGis service. By choosing the anonymous user (AnonymusUser) the group will be freely accessible.Editor user groups: define the user groups (Editor2) who manage the service.Viewer user groups: you define the user groups (Viewer) which have the credentials to view the content of the service.
Default base layer
In this session you define which base layer should be active at startup.
The choice is limited to the list of base layers activated for the cartographic group in which you work.
It is also possible not to define any active base layer at startup.
Description data
Public title: title of the WebGis service, it will appear at the font end level and in the header of the client.Description: Description of the project, it will appear at the public portal level.Thumbnail (Logo): logo to associate with the project. This image will be viewable in the list of projects within the cartographic groupURL alias: a human readable URL for the map. Only alphanumeric characters, not white space or special characters.
The title associated with the WebGis service is inherited by the following settings evaluated in the following order of priority:
Public title: if set
QGIS project title: if set on the General session of QGIS project properties
Name of the QGIS project file
Options and actions
User QGIS project map start extent as webgis init extent: check this control if you want set initial extent from QGSI project initial extent
Otherwise the initial extension will correspond to the maximum one defined on the basis of the extension associated with the WMS capabilities of the QGIS project (Project properties -> QGIS Server -> WMS capabilities (Advertised extent))
Tab's TOC active as default: set tab’s TOC (Layers, Base layers, Legend) open by default on startup of webgis serviceTab’s TOC layer initial status: it is possible to define whether the TOC layer list is collapsed or expanded when the WebGis service is startedMap themes list initial status: it is possible to define whether the list of themes (views) possibly associated with the project is collapsed or expanded when the WebGis service is startedLegend position rendering: this option allows to set legend rendering position:In a separate TAB: default value, the legend is rendered into a separate tab
Into TOC layers: the legend is rendered inside layers toc
Automatic zoom to query result features: if in the results of a search there are only features of a layer, the webgis automatic zoom on their extension
The next options allow you to define the type of WMS / WFS query to be carried out and the maximum number of results obtainable following a query.
Max feature to get for query*: max number of feature to get for single or multiple modeQuery control mode*: single or multipleQuery by bbox control mode*: single or multipleQuery by polygon control mode*: single or multiple
ATTENTION: contents marked with * are mandatory.
After filling in the various form, click on the Save button to confirm your choices.
If the operation is successful we will see the new project appear in the list of projects in in the working Cartographic Group.
Embedded project
It is possible to publish QGIS projects that contain layers or groups of layers deriving from embedded projects. It is clearly necessary to publish the embedded project first and then those derived from it. An update of the embedded project will result in a consequent modification of all derived projects. The request to delete the basic embedded project causes a warning message as this operation will cause problems on all derived projects.
Define the WebGis order on the FrontEnd
The order of the WebGis services listed within the Thematic Group at the FrontEnd level reflects the order defined at the level of the corresponding administration session. It is possible to define a custom order by moving the published projects via drag&drop.
Update/ Manage WebGis services
To update a published WebGis service, access the list of projects in the Cartographic Group.
Click on the Edit  icon placed at the top of the WebGis service and reload the QGIS file with the changes made in the relevant form.
Click on the SAVE button to confirm the change.
Always starting from the list of WebGis services, it is possible to manage numerous functional aspects associated with them.
Basic tools
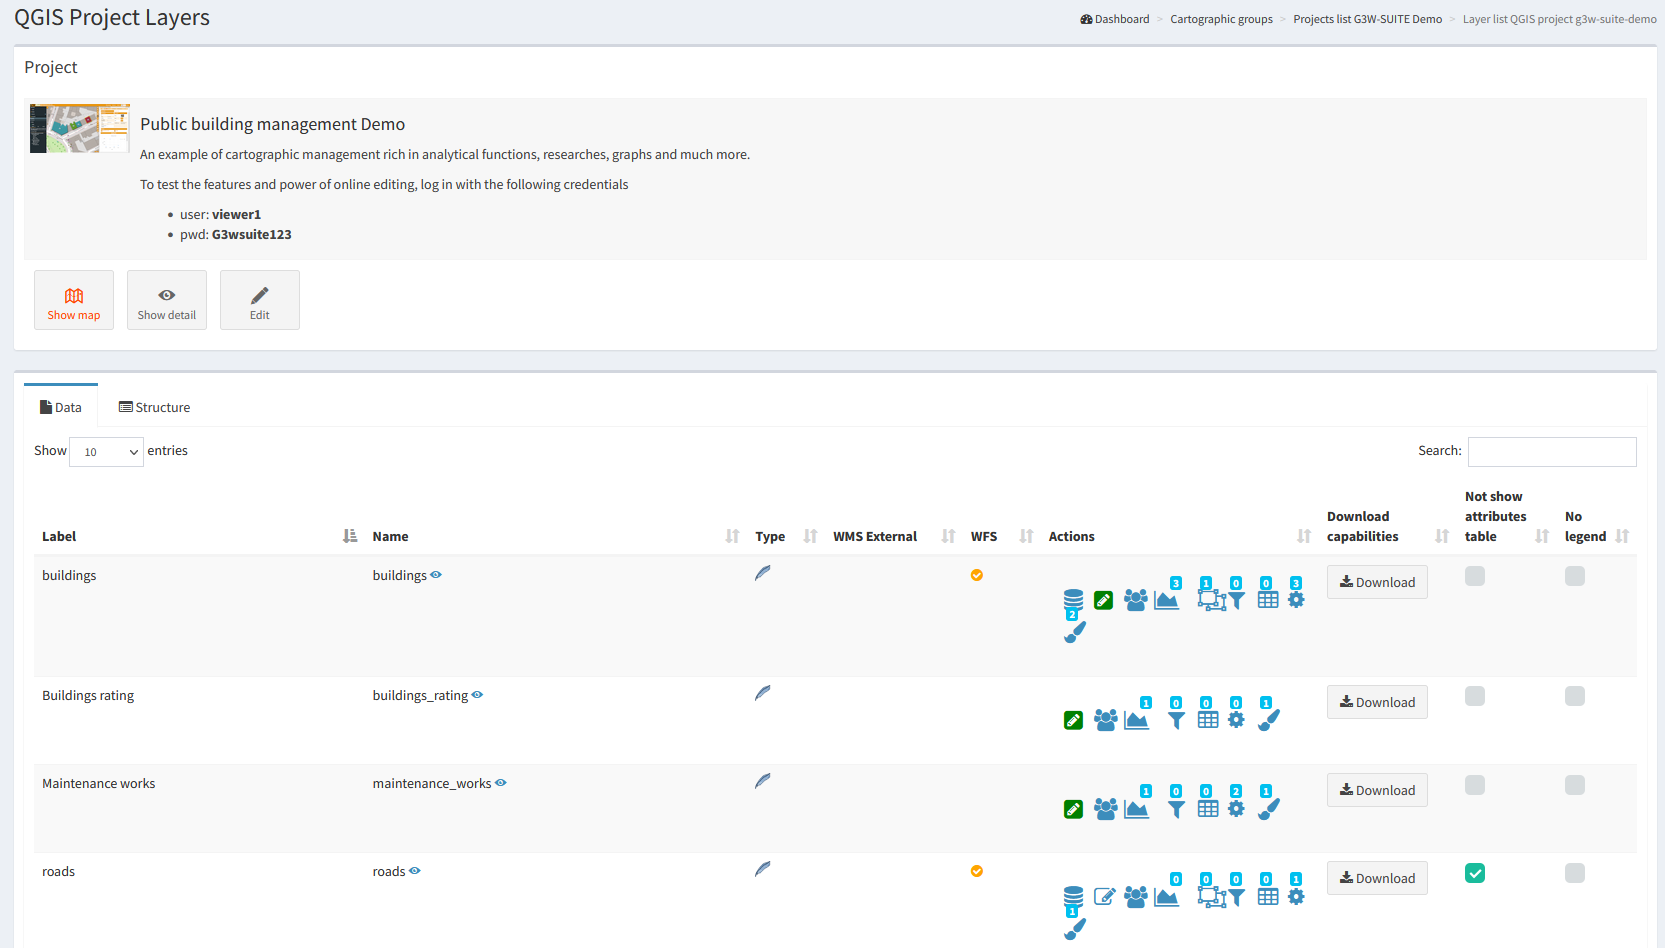
In this section it is therefore possible to view the list of cartographic projects present, view them, manage them and create new ones.
Through the single icons, placed at the level of each project, it is possible to:
 Display the cartographic project on the WebGis interface: to check the display by the user
 Access the list of layers present within the project and define their functional aspects
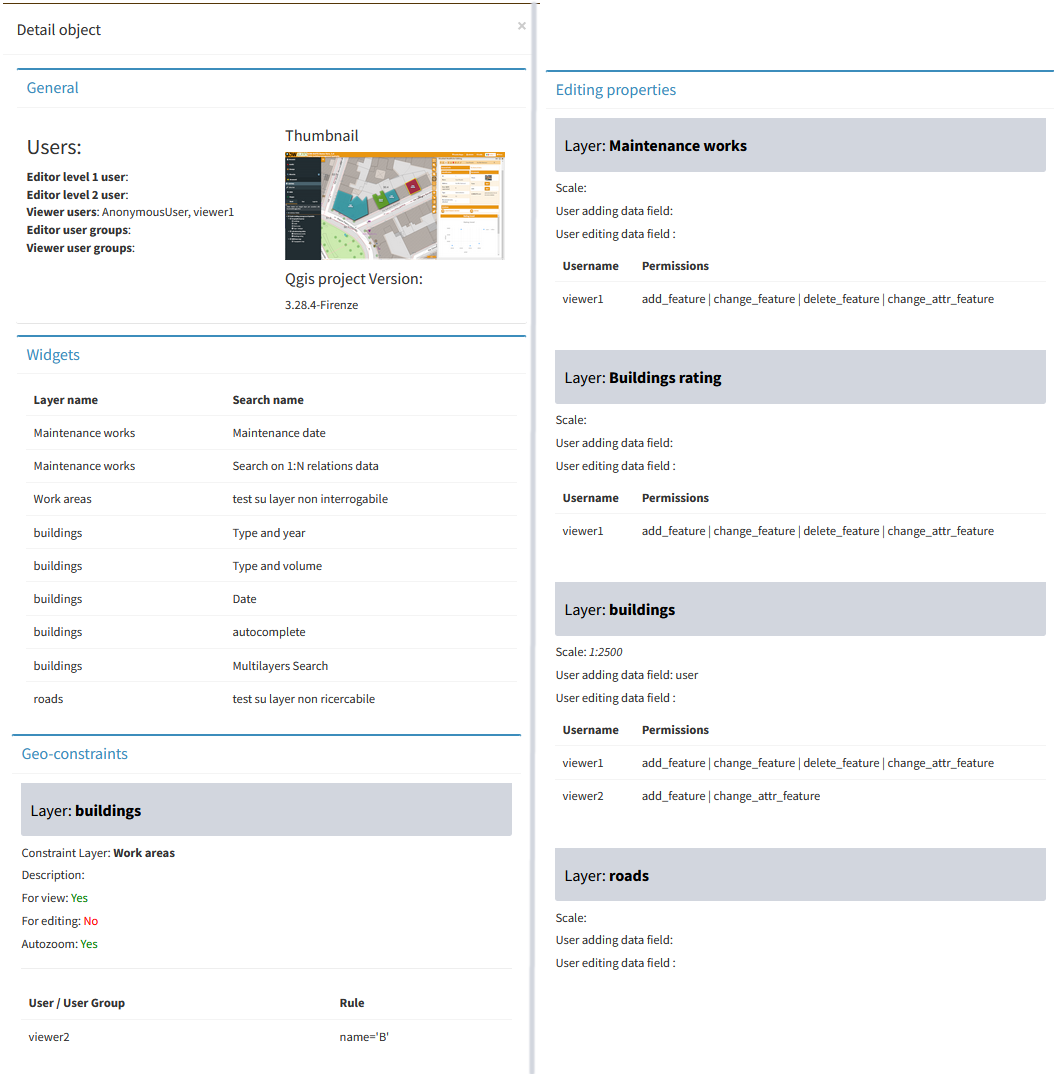
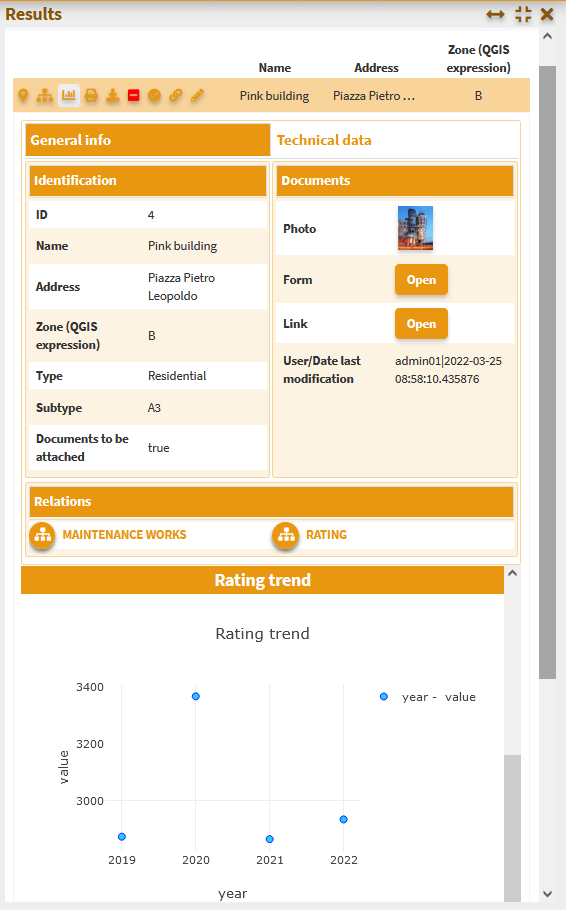
 Show details: for each WebGis service it will be possible to access a detailed summary that will list all the activated settings and widgets:
access and modification permissions
the list of active searches
editing permissions on individual layers
definition of alphanumeric and geographical constraints
visibility constraints on layers
visibility constraints on attribute fields
 Test the WMS Capabilities of the project
- Update a project: update of the QGIS file and other options related to the project
 Remove a cartographic project
Warning: removing a project also removes all the widgets (e.g. searches) that would be orphaned after the project has been removed
Remove a cartographic project
Warning: removing a project also removes all the widgets (e.g. searches) that would be orphaned after the project has been removed Download of the QGIS project
 List of OGC services associated with the project
 Messages the tool allows you to define personalized (timed) messages visible when the WebGis service starts
Below are some insights into specific features
Show details
A useful tool for having a summary of all the settings and functions connected to the project.
Messages
The tool allows you to define personalized (timed) messages visible when the WebGis service starts.
By clicking on the icon, the messages associated with the service are displayed.
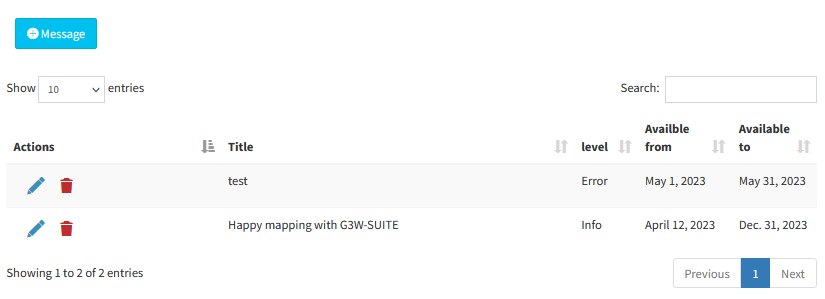
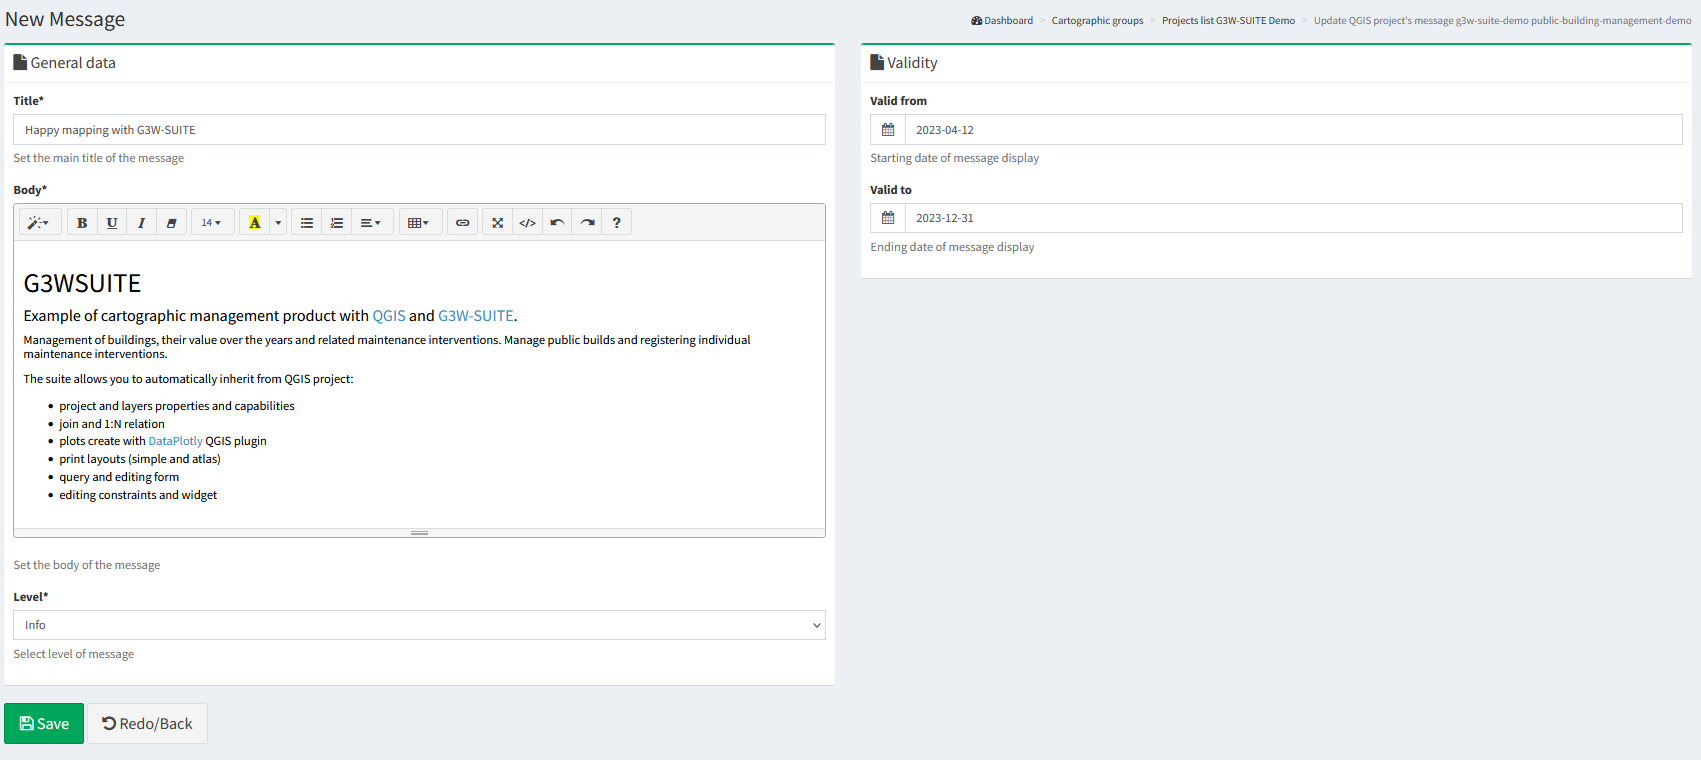
Using the + Message key it is possible to create a new message by defining:
title
message body (also in html)
message type (info, warning, error, critical)
validity period (optional)
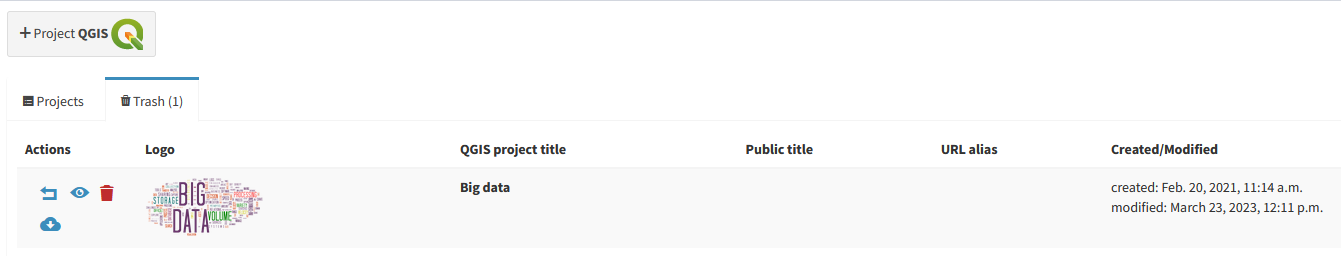
Project Trash
The operation of deleting a Project is not definitive. The Project with all its related content (widgets and settings) is moved to the Trash session.
It is possible to access the list of trashed Projects and the restore functions through the tab Trash positioned just above the list of published projects
Restoring a Projetc involves restoring all the accessory settings/functions of the project (permissions, searches, editing settings, downloads, etc…).
Deleting a project from the trash is an irreversible action.
Setting up the overview map for WebGis services
In this session it is also possible to define which of the cartographic projects loaded within the group will be used as a panoramic map.
To set the panoramic map, choose the projects and tick the check box in the Overview column.
Widget management
Once a cartographic project has been published, thougth the icon it is possible to access the list of the geographical states that compose it and define some functional aspects that will be enabled at the cartographic client level.
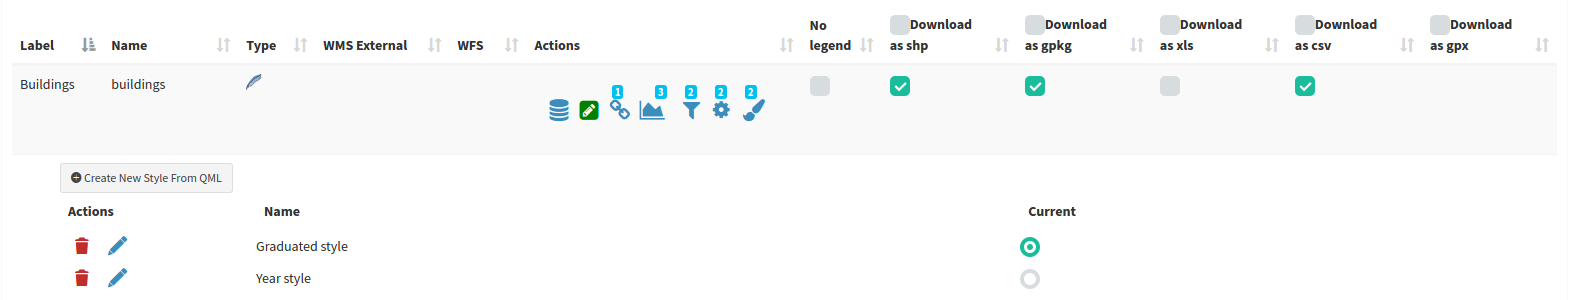
Next to each layer are a series of icons and checkboxes:
Label: layer alias applied at the QGIS project level
The eye icon allows you to know the ID associated with the layer at the project level, this ID will be useful for creating parameterized URLs
Name: name of the layer (file or DB table)
 Type: illustrates the type of data (WMS, PostGis, SpatiaLite, GDAL / OGR …)
WMS external: to speed up loading, the WMS layers present in a QGIS project are managed directly by Django and not by QGIS-Server.
In case of non-external WMS, the service is managed by Django and this eliminates cross-domain problems but the only managed GetFeatureInfo response type is GML.
The external WMS option allows obtaining a response to the query (GetFeatureInfo) even if the response is not in GML but also in HTML or text/plain format.
WFS: a check mark shows whether the layer is published as a WFS service or not
Actions: a series of icons dedicated to various functions
 Caching Layer: allows you to activate and manage the cache of the single layer at the project level
 Editing layer: shows if the online editing function is active on the layer and allows you to activate and define it
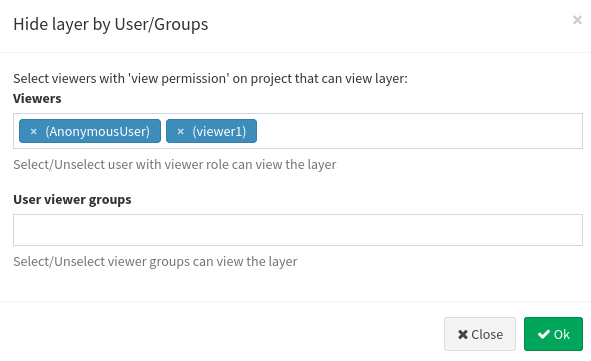
 Hide layer by user/groups: hide specific layers from the TOC based on specific users or groups of users
 QPlotly widget: add or manage plots created with DataPlotly QGIS plugin
 Geo-constraints by user/group: create or manage editing and visualization geo-constraints based on poligonal layers
 Alphanumeric and QGIS expressions constraints by user/groups: create or manage editing and visualization constraints based on SLQ language or QGIS expressions
 Hide columns by User/Groups: create or manage constraints on one or more fields of a layer based on single or group user/s
 Widgets list: shows how many widgets (eg searches) are associated with this layer and allows you to activate new ones
 Manage layer styles: manage multi-style layer
Download: allows the download of the geographic and not geographic layers in various formats
Download as shp/geotiff: for vector and raster layers
Download as GPK: for geographic or not geographic layers
Download as xls: for all types of layers, in .xls format
Download as csv: for all types of layers, in .csv format
Download as gpx: for geographic layers, in .gpx format
Not show attributes table: hide attributes table of the layer for every users
No legend: it allows to define if the layer must have published the legend at TOC level of the WebGis client
The number above each Action icon shows if and how many related objects are present.
The functions present in the Actions session are described below.
Caching layer (Base Map)
With this icon it is possible to activate/manage the cache of the single layers and create XYZ Tiles layer that you can use as Base Layer in your webgis.
The form allows you to:
Active: enable cache on the layer
Action:
Reset cache: limited to the specific layer
Reset cache for project: reset cache of all the layers in the project
If the published project contains only one layer is it possible to convert this WebGis service into a Base Layer.
To do this you need to activate the Base layer option form and fill in the second part of the form:
Base layer title
Base layer description
Base layer attribution
The newly created base layer will be available to be associated with those available for the various Cartographic Groups.
Editing layer
Through this icon it is possible to activate the online editing function on the individual layers and define the permissions for individual / groups of users
See the dedicated paragraph in the Editing on line session.
Hide layer by user/groups
With this icon it will be possible to define the list of users (single and/or groups) who will be enabled to view this layer at the TOC and map level.
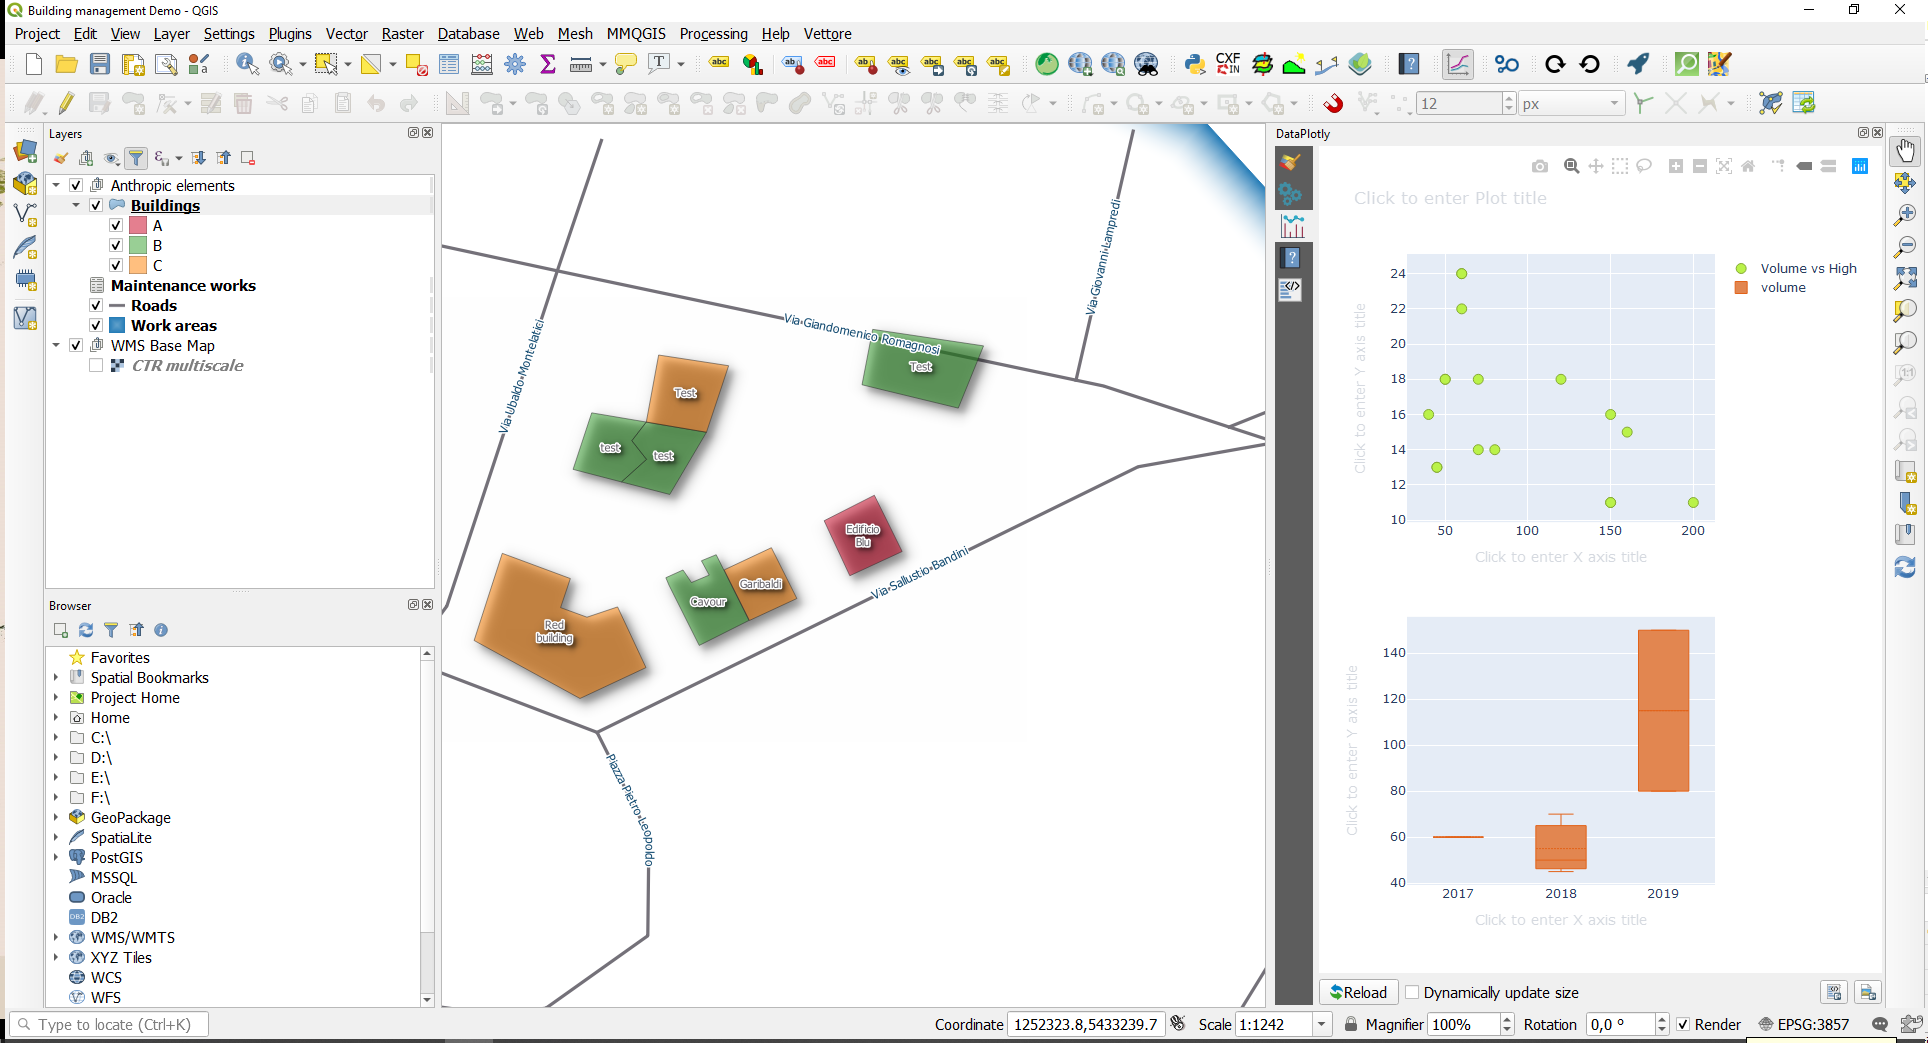
QPlotly widget
View plots created using QGIS DataPlotly (a great plugin developed by Matteo Ghetta) in the cartographic client.
The module, based on the Plotly library, manages plots saved as xml.
The plots are connected to the layers defined on the QGIS project, in this way, as for the searches and the constraints, it is possible to activate (checkink the Linked checkbox) the same plots on all WebGis services in which the reference layer is present.
It is also possible:
download the plot XML file to reuse it in QGIS
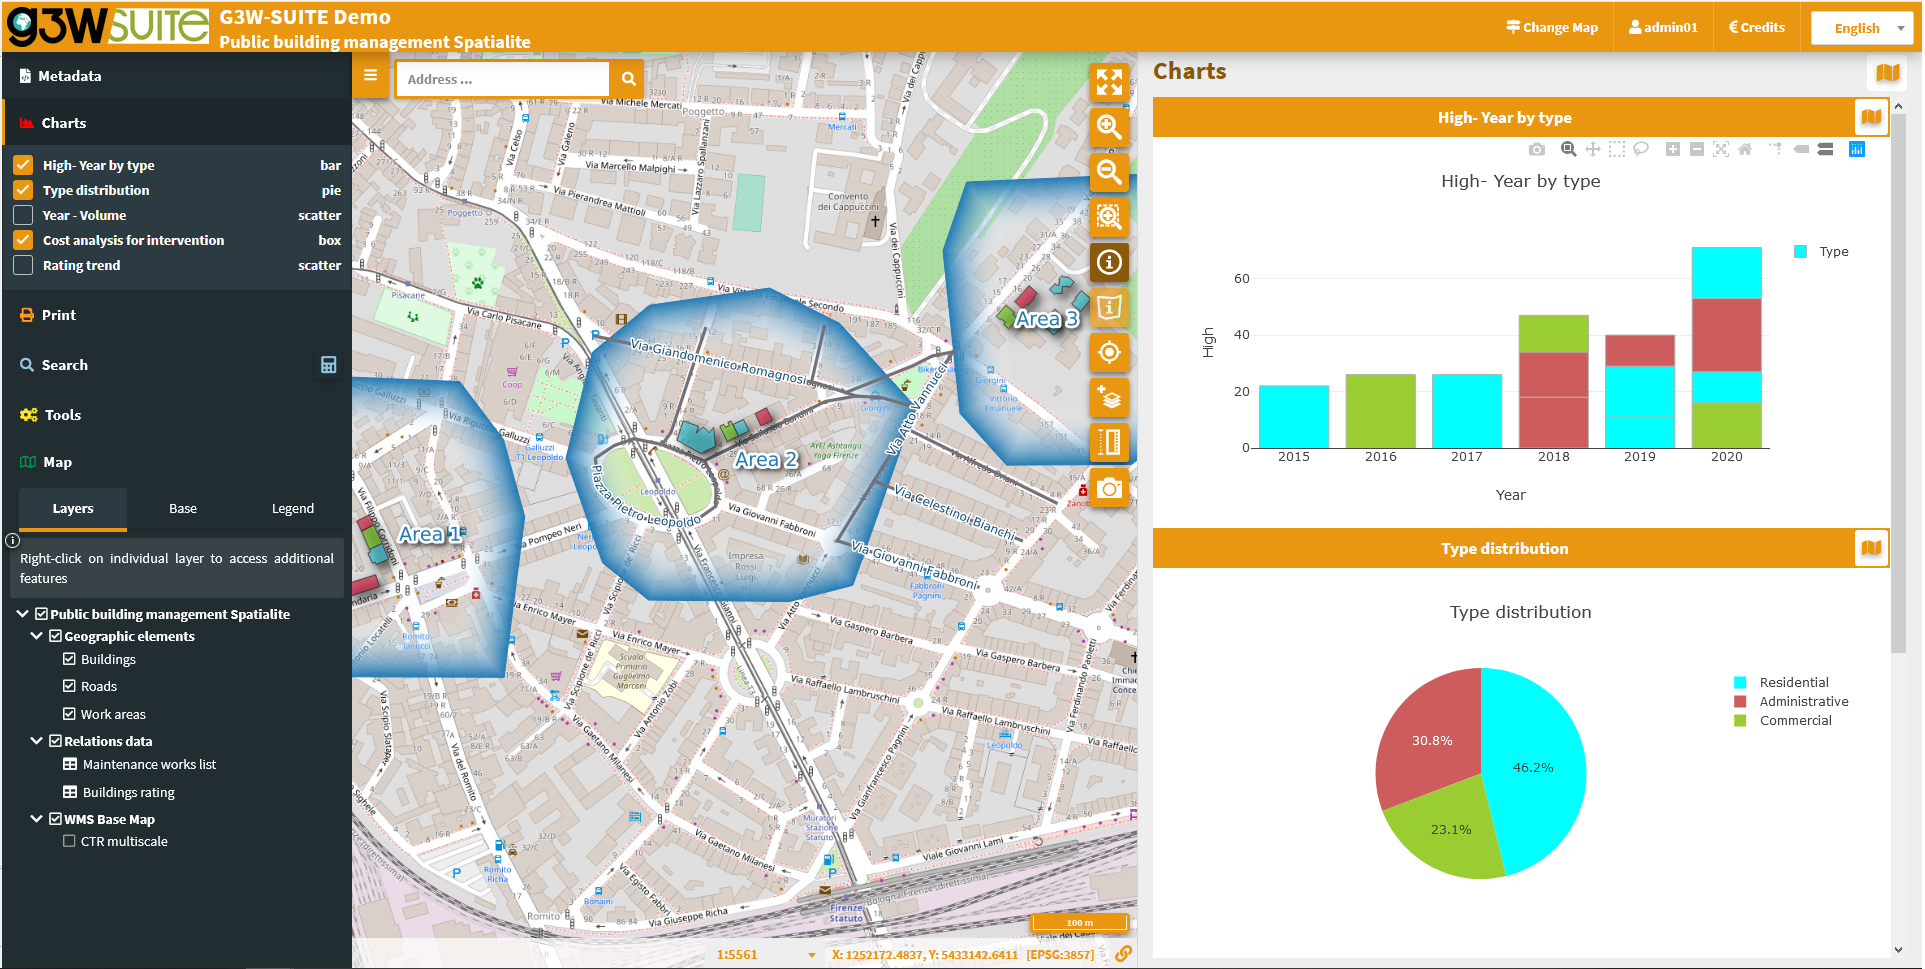
define the activation status of the plots when the WebGis service is started
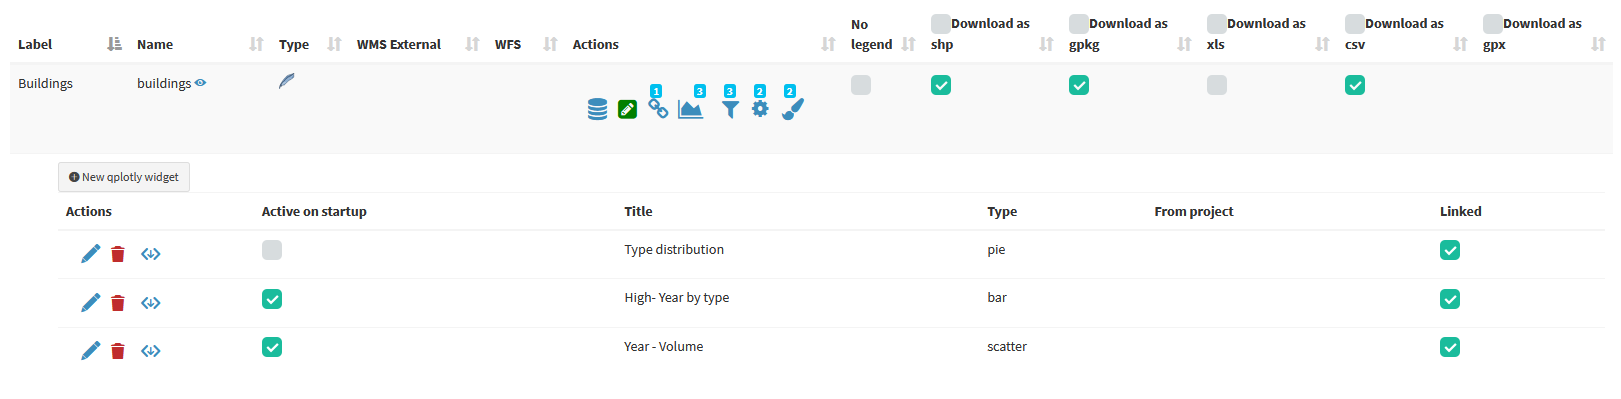
The title of the chart, defined at the plugin level, will be the unique identifier.
At client level, it will be possible to filter plots based on the geometries visible on the map and/or selected by the user.
Charts based on 1:N data relation (child layer)
If the chart is linked to a child layer in a 1:N relation, it can also be displayed at the information level of the individual parent features
Display and editing constraints
Through the Geo-constraints by user/group and Alphanumeric and QGIS expressions constraints by user/groups widgets it is possible to define editing and display filters for users authorized to consult/edit the project.
See the dedicated paragraph in the Editing on line session.
Hide columns by User/Groups
Thanks to this function it is possible to hide specific fields of a layer for consultation. This constraint can be differentiated for individual users or groups of users.
This setting is also available for the AnonymousUser user
To activate this type of constraint, you must click, at the level of the layer of interest, on the Hide columns by User/Groups icon ![]() .
.
Clicking on the icon will show the list of any existing alphanumeric column constraints and the item + Create New Column Level constraints to create a new one.
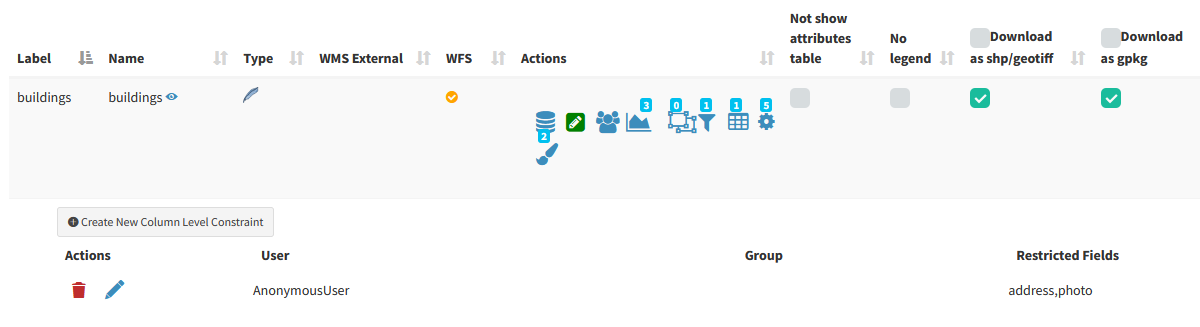
Clicking on the item will open a modal window which will allow you to define:
user or group of user
list of fields to hide to them
Once all the constraints have been setted, click on the OK to confirm the rules.
Widget setting - Search tools
Using this icon it is possible to associate a series of widgets to the layer. The basic widget allows you to define search tools that will be available in the webgis.
Basic settings
In G3W-SUITE it is possible to create search widgets.
By default, searches can be built on individual vector layers based on the fields of the table associated with the layer.
NB: to create searches based on fields derived from simple joins (1:1/N:1) or from 1:N relation, you have to change the setting of the method used (from WMS to QGIS API). See dedicated paragraph.**
Every search widget will be saved by referring to the layer identifiers (for example the DB parameters: IP, DB name, schema, layer name).
This aspect allows, once a search widget for a layer has been created, to have it available on all the projects in which the layer is present, without having to rebuild the widget from scratch each time.
In the list of layers present within the project, identify the layer on which to create and associate the search widget and click on the icon ![]()
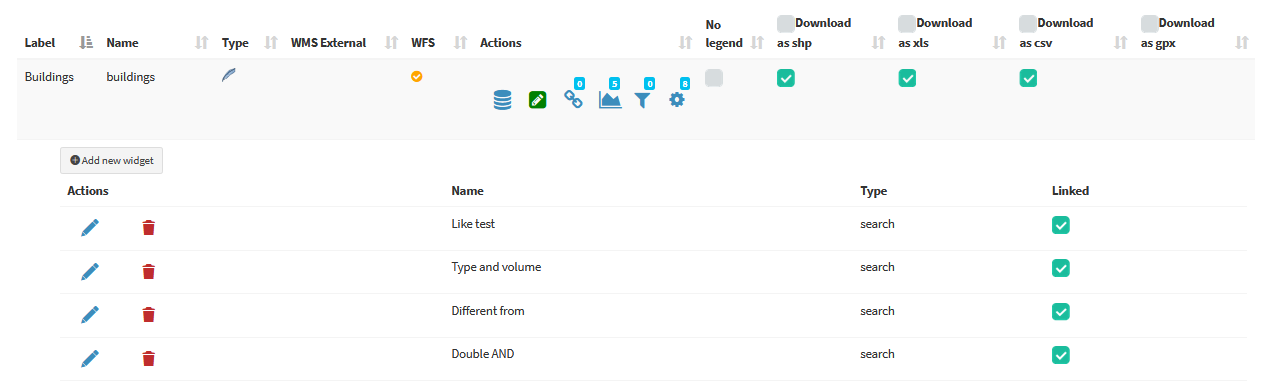
By clicking on the icon, the list of already active (or activatable) widgets associated with the layer will be shown.
These widgets can be modified, deleted or disconnected using the appropriate icons.
ATTENTION: deleting a search will delete it from all projects in which that search is active.
To deactivate a search from a project, simply disconnect it using the check-box on the right.
To create a new search, click on the link New widget.
In the pop-up that appears, the Search type have to be chosen.
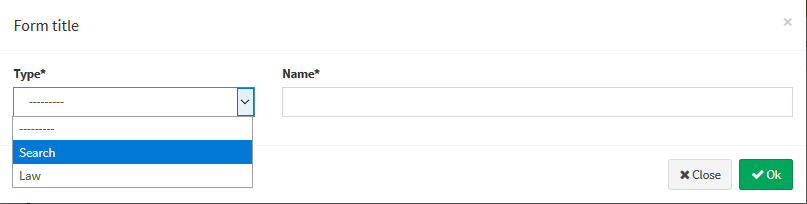
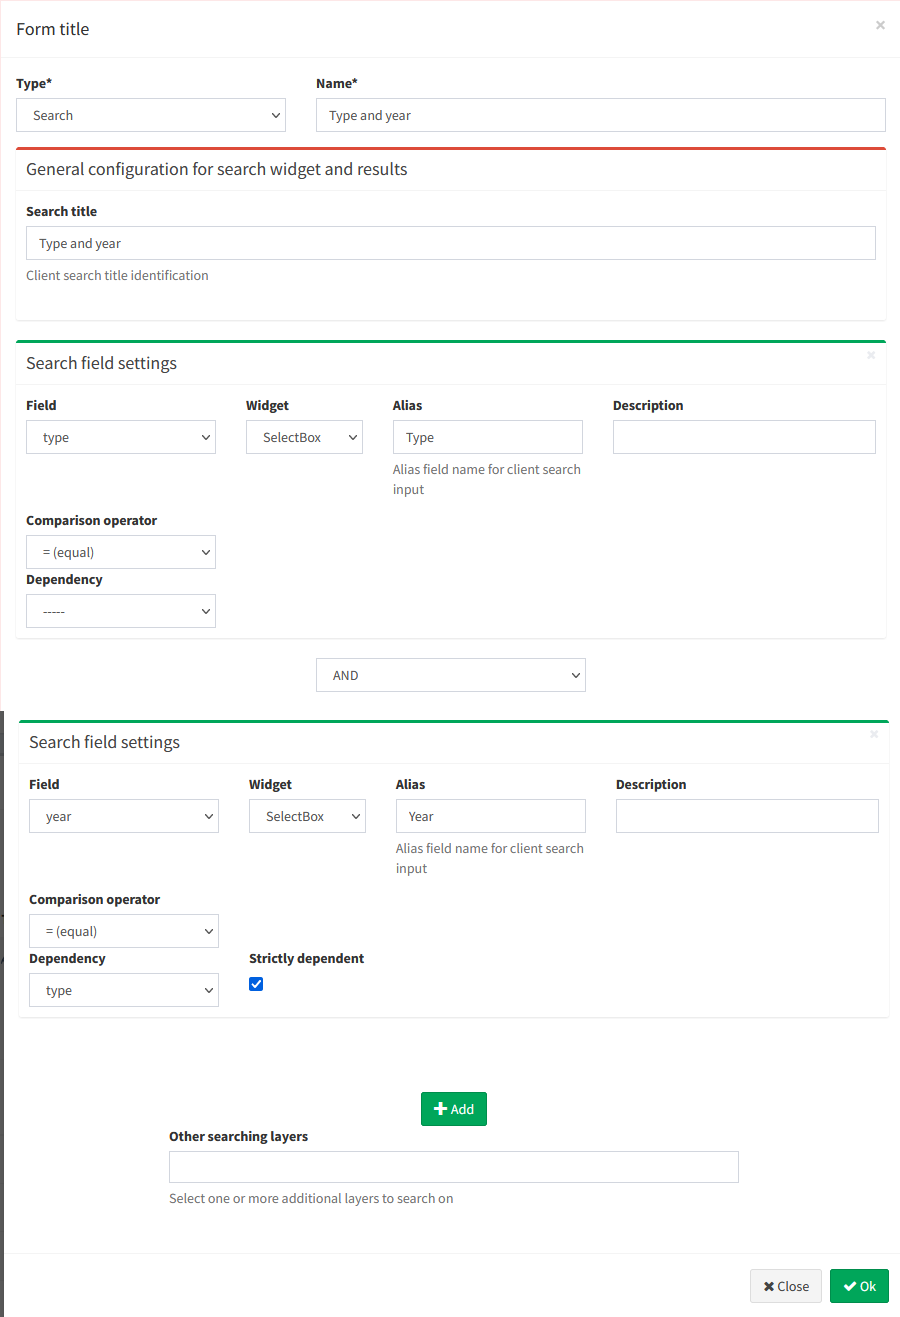
In the related form we can define:
Form Title
Type: “Search”Name: name that G3W-SUITE will use to internally register the search widget.
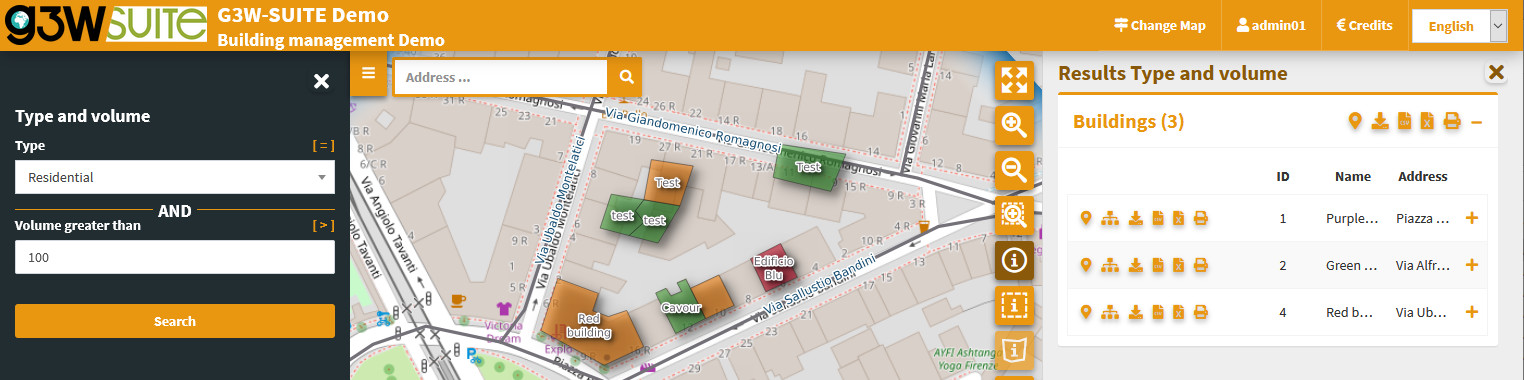
General configuration of research and results
Search title: title that will become available in the ‘Research’ panel of the WebGis interface
Search fields settings
Field: field on which to carry out the researchWidget: method of entering the value to be searchedInputBox: manual compilationSelectBox: values shown via drop-down menuAutoCompleteBox: values shown through auto-complete modeDateTimeBox: widget to be used exclusively for date type fields. On the client, the user will define the date/time to search through the calendar/clock widget.
Alias: alias assigned to the field that will appear in the search formDescription: description assigned to the fieldComparison operator: comparison operator (=, <,>,> <,> =, <=, LIKE, ILIKE) through which the search query will be carried out.Dependency: this parameter (optional) allows, only in the case of SelectBox or AutoCompleteBox widgets, to show the list of values of a field filtered according to the value defined for the previous fields.
Now it is possible to define the dependence more or less strong (strictly).
In case of strictly dependence, the values of the dependent fields will be loaded only after the choice of the value of the field on which the dependency depends.
Otherwise it will be possible to define the values of the individual fields freely and without a specific order. The values available for the other fields will in any case depend on the choice made.
Warning: in the case of fields with more than 100 unique values, the WMS service does not allow to obtain the complete list of values. In this case it is recommended not to use the SelectBox method
Alternatively, you can use the QGIS API as a search method to overcome this limitation. See dedicated paragraph.
The button  allows you to add additional fields for the construction of the search query currently manageable through AND/OR operators.
The example below shows the compilation of the form for creating a search widget dedicated to a cadastral cartography layer.
Once the form has been filled in, click on the OK button to save the settings.
Once the settings are saved, the created widget will appear in the list of Widgets associated with the layer.
The widget will already be connected and therefore available in the WebGis interface.
IMPORTANT: the created search widget will now be available (disconnected) for all projects in which the layer with which it has been associated will be present.
This will allow you not to have to recreate the widget several times and to decide in which projects to activate the search and in which not.
Multiple layers search
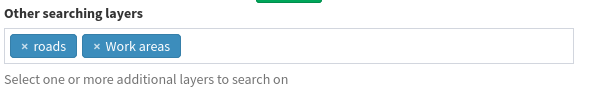
The Other searching layers option allows you to extend the search carried out to other layers.
If the additional layers have homologous fields (same name and type) the search will be extended to them.
The results will be differentiated according to the corresponding layer.
Especially useful in the case of multigeometric layers.
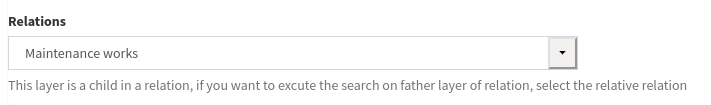
Search based on 1:N relation data
The option allows you to create a search based on the fields of a table (child in a 1:N relation) and obtain results relating to the parent layer of the relation.
N.B. to create searches based on fields derived from simple joins (1: 1 / N: 1) or from 1: N relation, you have to change the setting of the method used (from WMS to QGIS API). See dedicated paragraph.
The Relations option allows you to to define the relationship to be used (if present) to identify the parent layer whose results will be shown.
Manage layer styles
If multi styles have been associated with the same layer in the QGIS project, they will be exposed.
It will be possible to associate new layers by loading related QML files and set the style to be used as default.
Multilinguage
By default the suite manages four languages:
English
French
Italian
Finnish
Swedish
Romanian
Portuguese
Other languages can be added.
Map client
On the top bar you can choose, through a drop-down menu, the language of the entire client interface.

Administration
Also for the Administration panel, through the same drop-down menu, it is possible to define the language of the entire interface of the console.

Front end
Fixed front end content is already available in the four basic languages.
Variable contents, i.e. user-definable contents, are instead translated:
Sessions
Home,About,MapsandLogin: content that can be defined and translated in the Edit General Data session of the Control Panel AdministrationSessions
MacroGroups Cartogarfici,Groups CartogarficiandWebGis Services: contents definable and translatable in the form defining these elements, limited to the items:Public Title
Description
To carry out the translation of these contents, proceed as follows:
access to the form for creating the element (MacroGroup, Group or WebGis Service)
define one of the available languages from the drop-down menu at the top right
fill in the form in the chosen language
save the settings
Then:
access the form again in modification
change the language
fill in the translatable content in the new language
save the new settings
Titles and Descriptions of the various elements in the defined languages will be available on the front.