G3W-CLIENT: the cartographic client
Aspetti generici
L”applicazione ha un”interfaccia responsiva costituita da sessioni espandibili e riducibili. La barra di testa contiene i seguenti elementi:
Il colore dell”interfaccia dipende dalla tipologia di utente loggato.
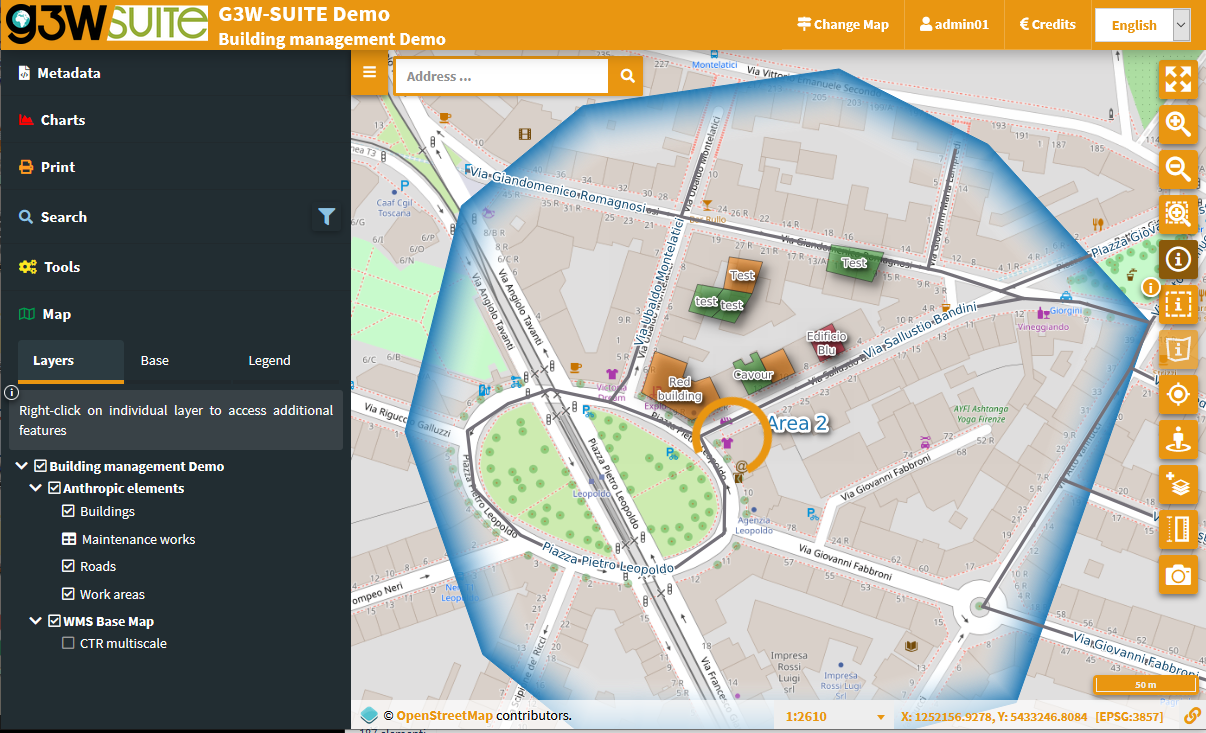
The header contains the following elements:
Logo, titolo e sottotitolo, derivanti da:
titolo principale (impostato a livello di Dati Generali) o nome MacroGruppo, in base alle impostazioni
nome Gruppo Cartografico
titolo servizio WebGis
Cambia mappa: che permette di passare da un servizio WebGis, posto all”interno del solito Gruppo Tematico, ad un altro mantenendo estensione e scala di visualizzazione
Identificativo dell”utente: nel caso sia stato effettuato l”accesso al sistema
Credits
Home: per accedere al FrontEnd
Lingua: la scelta della lingua si riflette nei singoli menu del clienta e sui contenuti del portale di accesso. Le linguedisponibili sono quelli attivati dall”amministrazione.

Il Pannello Strumenti é posto a sinistra e contiene i seguenti oggetti:
Metadati: contenuto definito su progetto QGIS
Stampa: strumento di stampa basato sui layout definiti su progetto QGIS
Ricerche: con i tool di ricerca definiti tramite pannello di Amministrazione
Strumenti: sessione che raccogli i vari strumenti eventualmente attivati sul servizio WebGis
WMS: session to add custom WMS services to the map
Mappa: contenente:
Strati: elenco strutturato degli strati, definito su progetto QGIS
Basi: scelta della mappa di base tra quelle definite a livello di creazione Gruppo Tematico
Legenda: legenda grafica dei vari strati
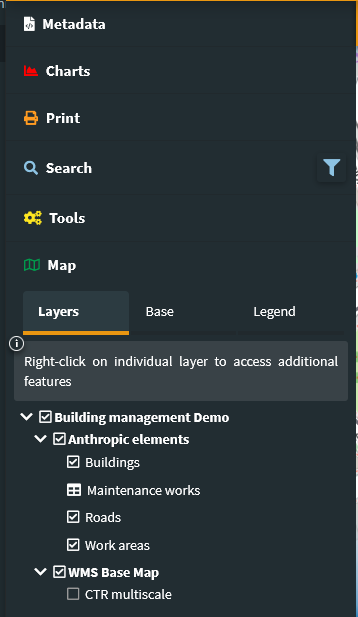
In the event that Themes (Views) are defined in the QGIS project, a specific choice menu will be available in the Layers session of the TOC.
The choice of a Theme will determine the automatic activation of the layers and related styles, defined in the Theme itself.

Navigazione e interazione con la mappa
Area di mappa
Il footer dell”area di mappa mostra:
la scala di visualizzazione (modificabile)
mouse coordinates: coordinates can be shown in project projection system and in WGS84 LatLong (ESPG: 4326)
il sistema di proiezione del progetto
un”icona per copiare l”URL del servizio con riferiemnto all”estensione visualizzata al momento

Controlli di mappa
Di seguito si riportano le icone e la descrizione delle funzionalità dei diversi MapControls attivati a livello di Gruppo Cartografico.

zoomtoextent: zoom all”estensione iniziale
zoom: zoom in e zoom out
zoombox: strumento di zoom basato su disegno di un rettangolo
query: interrogazione puntuale strati geografici
querybbox: interrogazione tramite box degli strati - N.B. gli strati interrogabili devono essere pubblicati come servizi WFS sul progetto QGIS
querybypolygon: sarà possibile interrogare automatica le features di uno o più strati che cadono all”interno di un elemento poligonale di uno strato guida. (Es. cosa c”è dentro una particella catastale?). - N.B. gli strati interrogabili devono essere pubblicati come servizi WFS sul progetto QGIS
geolocation: strumento di geolocalizzazione (utile per consultazione da tablet)
nominatin: strumenti ricerca indirizzi e toponimi basato su OSM
streetview: StreetView di Google sulla tua mappain the presence of GoogleMaps API Key, StreetView it is integrated on the client and synchronized with the position and direction of the icon on the map
in the absence of GoogleMaps API Key, StreetView it will open on a new browse tab without the aspects of synchronization with the map

lunghezza: strumento di misura di tratti lineari
area: strumento di misura di superfici
addlayers: tool for temporarily uploading GML, GeoJson, KML, GPX, SHP (zipped) and CSV with coordinate to WebGis. These layers will remain until the end of the work session
snapshot: strumento per realizzare snapshot dell’area di mappa
GeoSnapshot: tool to export a GeoTIFF of the map area
Query type
Si precisa che la funzione di interrogazione agisce, di default, con il metodo del carotaggio fornendo informazioni relativamente a tutti i layer che sottostanno al punto in cui si clicca con il mouse o si disegna un riquadro.
Per interrogare un singolo layer occorre che questo sia precedentemente selezionato a livello di TOC.
Remember that query modes based on querybbox and querybypolygon require the publication of all the layers involved as WFS services at the QGIS project level.
NB: Si ricorda che, in seguito alla visualizzazione dei risultati, sarà possibile zoommare sulla feature associata ai singoli risultati soltanto se a livello di progetto QGIS è stata attivata l”opzione Aggiungi la geometria alla risposta dell'oggetto a livello di menù Progetto → Proprietà Progetto, sessione QGIS Server.
Map query
A livello di progetto QGIS (Proprietà del vettore → Attributes Form), per ogni layer, è possibile definire degli specifici form per la visualizzazione strutturata dei risultati di un interrogazione (schede, gruppi…)
Upon querying a geometry, the form structure will be replicated at the client level.
Eventuali collegamenti a foto determineranno la visualizzazione di un anteprima cliccabile, eventuali collegamenti a link o ad altri contenuti multimediali determineranno la visualizzazione del tasto Apri che permetterà al consultazione del collegamento.
Per approfondimenti su questo punto vedi il paragrafo Visualizzazione di contenuti multimediali.
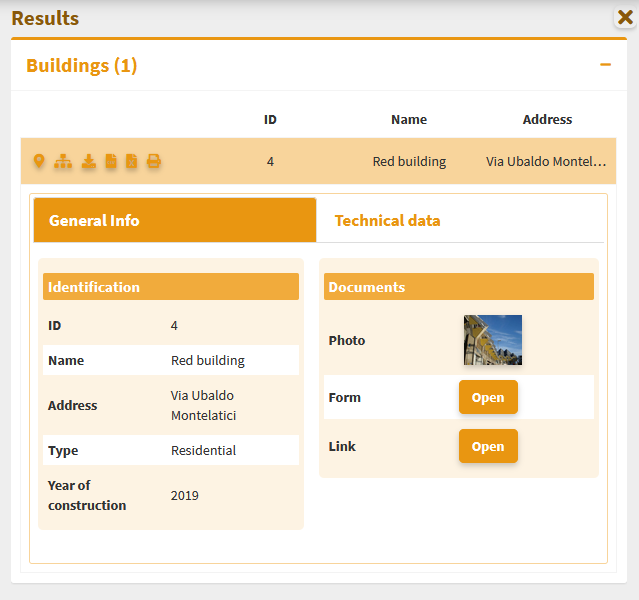
Single result
In case the query provides one single result, the attributes will be displayed according to the form defined in the QGIS project or as a column list

The bar above the query results shows the following icons:
![]()
Zoom to feature: if the function is activated on the Properties of the QGIS project
Show relations (1: N): if present on the QGIS project
Show relation charts: display of plots related to 1: N related data. Only if 1: N relationships are associated with the interrogated layer and plots have been activated on the referencing tables.
Print Atlas: prints the reports (atlas) (if set on QGIS project) related to the queried feature
Download single results (Shapefile, GPK, GPX, CSV, XLS): if activated in the administration session
Remove feature from result: remove the feature to the current list of results (useful to choose manually the list of objects to select/download)
Add/Remove selection: add/remove the features to the current selection
Copy map URL pointing to the geometry : to create a parameterized URL that points to this features
Editing: to start editing directly on this feature
Multiple result
In case the query provides more results these will be listed as a list with the possibility to expand the detailed information.

A series of icons, relating to the list of resulting features, will allow you to:
![]()
Zoom to features result extent: if the function is activated on the Properties of the QGIS project
Print Atlas: prints the reports (atlas) (if set on QGIS project) related to all the features result
Download all the features results (Shapefile, GPK, GPX, CSV, XLS): if activated in the administration session
Add feature on result: add features (clicking on the map) to the current list of results (useful to choose manually the list of objects to select/download)
Add/Remove selection: add/remove the list of features result to the current selection
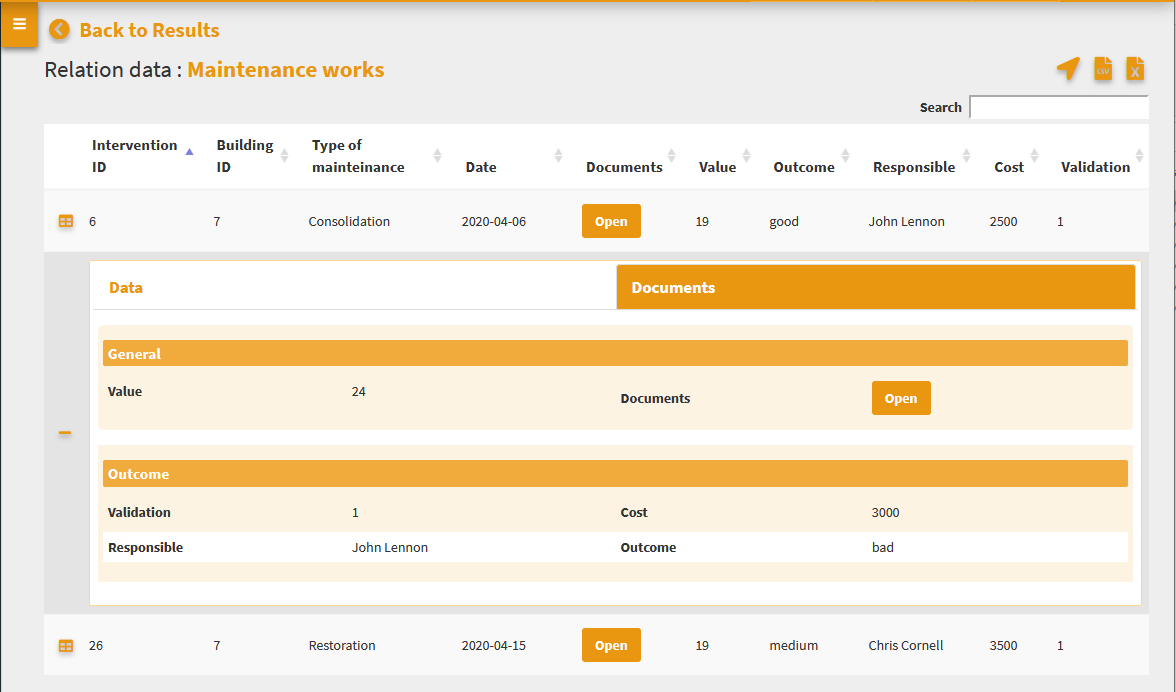
Visualizzazione di dati relazionati in modalità 1:N
In the event that, at the QGIS project level, one or more type 1:n relations have been associated with a layer, the icon View Relationships will be shown in the attribute form.
By clicking on the icon you will access the list of 1:N relations present and, from these, the list of child records associated with the individual relationships.
In the case of a simple 1:1 or N:1 joins, the joined records will be displayed directly in the main form.
In the new frame, a filter, applied generically to the contents of all fields, will allow you to filter the list of child records.
The icon to the left of each record allows you to switch from the classic table view to the one based on any form defined on the QGIS project
In caso di presenza di link a contenuti multimediali, saranno visualizzabili le anteprime delle immagini e/o il tasto Apri per la consultazione di diversa tipologia di contenuto.
In case of active plots on the related table, these will be displayed through Show charts at the top right.
Parameterized URLs
It is possible to create parameterized URLs for direct zomming to: geographical extension single feature by FID single/list features by value of a field
Here the URL paramters available:
map_extent (Zoom to map extent)
Ex:
<url_project>?map_extent=Xmin, Ymin,Xmax,Ymax
zoom_to_fid (Zoom to a specific feature by FID)
Ex:
<url_project>?zoom_to_fid=<layer_id>|<fid value>
ztf (Zoom to features defined on the basis of attribute values)
Ex:
<url_project>?ztf=<layer_id or layer name>:<field name>=<field value>
If Views (Themes) are set up in the QGIS project, it will also be possible to parameterize them in the webgis URL:
Ex:
<url>?map_theme=<theme_name>
Pannello Strumenti
Metadati
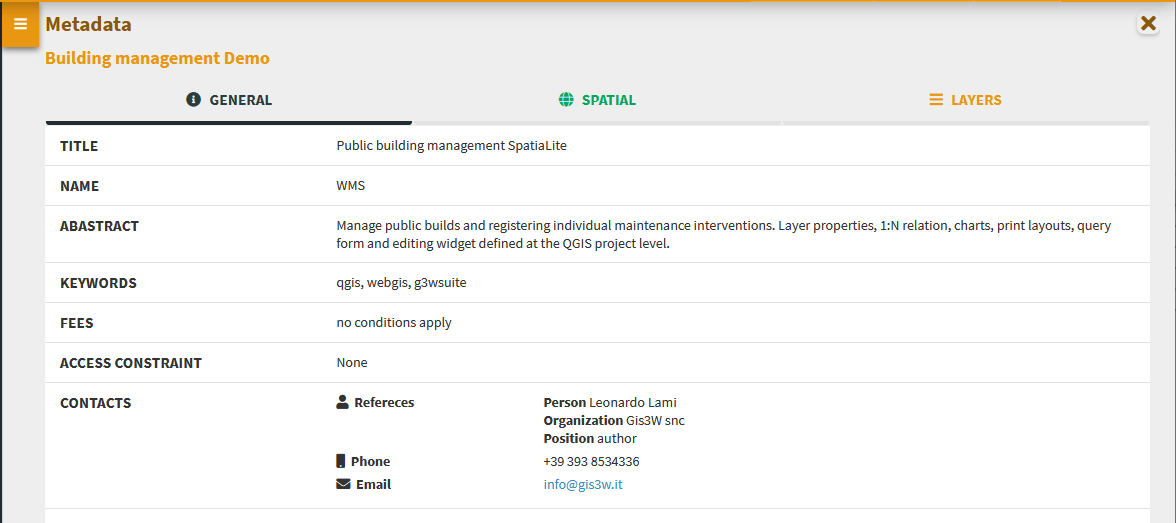
I Metadati riportati in questa sessione derivano da quelli impostati a livello di progetto QGIS.
Tale contenuto è diviso in tre sessioni: Generale, Info Spaziali e Strati.
Generale: riporta i metadati definiti su progetto QGIS a livello di menùProgetto → Proprietà Progetto, sessioneServer OWS, Capabilitiesdel servizio. In caso di accesso come utente anonimo in questa sessione è presente anche l”URL del servizio WMS di tael progetto.Info Spaziali: riporta il codice EPSG del sistema di proiezione associato al progetto QGIS e la BoundingBox relativa all”estensione iniziale di pubblicazione, definita a livello di menùProgetto → Proprietà Progetto, sessioneServer OWS, Capabilities WMS, Estensione pubblicataLayer: riporta i metadati associati ai singoli layer. Metadati definiti a livello delle Proprietà del layer
Charts
View graphs created using QGIS DataPlotly and activated at the admin session level.
Check the plots in the list and consult them on the rigth panel.

The graphs are filterable based on the:
 features visible on the map
 filter based on the selected features
These filters are also reflected on the plots associated to the related data (in 1:N mode) based on the visible and/or selected parent features.
The filter based on the map content can be activated globally on all plots (icon at the top of the panel dedicated to charts) or on only some specific plots (icon placed at the level of the individual plots).
The plots will automatically update after pan and zoom operations on the map
If activated, the filter based on the selected features is automatically activated on all related plots (associated with the same layer and with the 1:N relationed tables)
Appropriate messages at the single plots level will indicate the activation of these filters.
Charts based on 1:N data relation (child layer)
If the chart is linked to a child layer in a 1:N relation, it can also be displayed at the information level of the individual parent features
Stampa
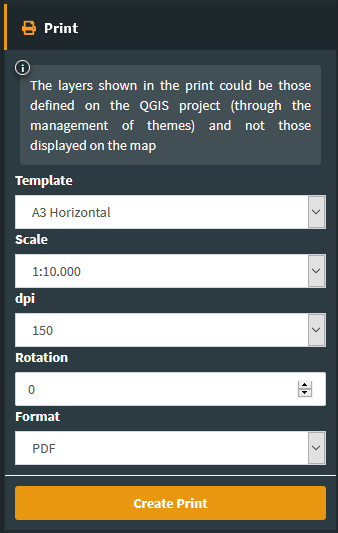
Strumento di stampa basato sui layout definiti su progetto QGIS.
Lo strumento permette di scegliere:
Template: layout di stampa tra quelli associati al progetto QGIS pubblicato
Scala: scala di stampa
DPI: risoluzione di stampa
Rotazione: angolo di rotazione
Formato: stampa in PDF o JPEG
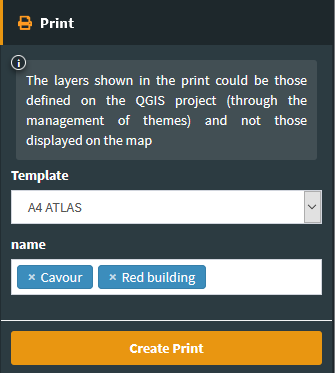
Custom title: using the ItemIDs at the print layout level of the QGIS project it is possible to insert one or more labels with customized content in the print from WebGis
On the map, a light rectangular area will allow you to define the print area.
If an Atlas type print layout is associated in the QGIS project, the layout reference will be available. The cards to be printed are defined by referring to the atlas identifier defined in the print layout.
WMS
Through this tool the user can add custom WMS layers to the WebGis service.
The user can add one or more WMS URLs (associated with a customizable name) and, for each of them, define:
the position (top or buttom) with respect to the other layers of the project
the layer to load
the projection system to be associated
a custom name

When the first custom WMS is added, a new tab (WMS) appears in the TOC; here you can switch on/off or delete the individual added WMS layers.

The added WMS layer cannot not be queried.
The list of WMS services and the specific WMS layers added will remain available to the user until the browser cache is cleared.
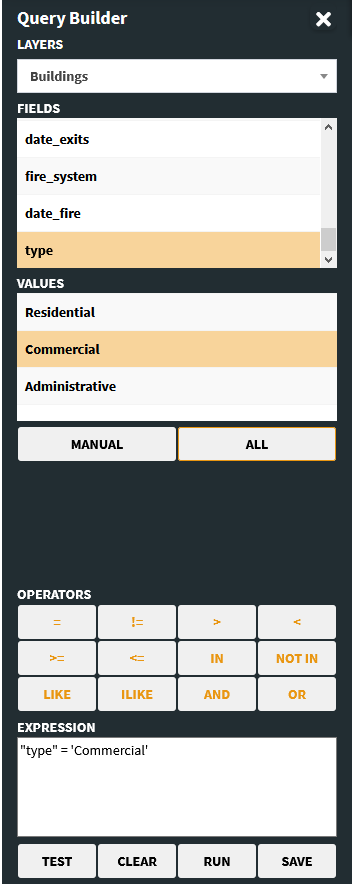
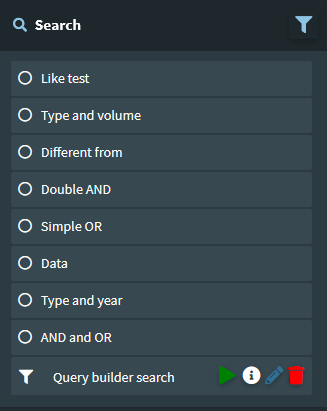
Search and Query Builder
A classic Query Builder is present at the Search menu level. Through this tool it is possible to:
carry out alphanumeric searches on geometric layers
save the query to reuse it until the end of the work session
edit a previously saved query
The saved query will be available until the browser cache is cleared
NB: fields not exposed as QGIS project-level WMS are not available for query building.
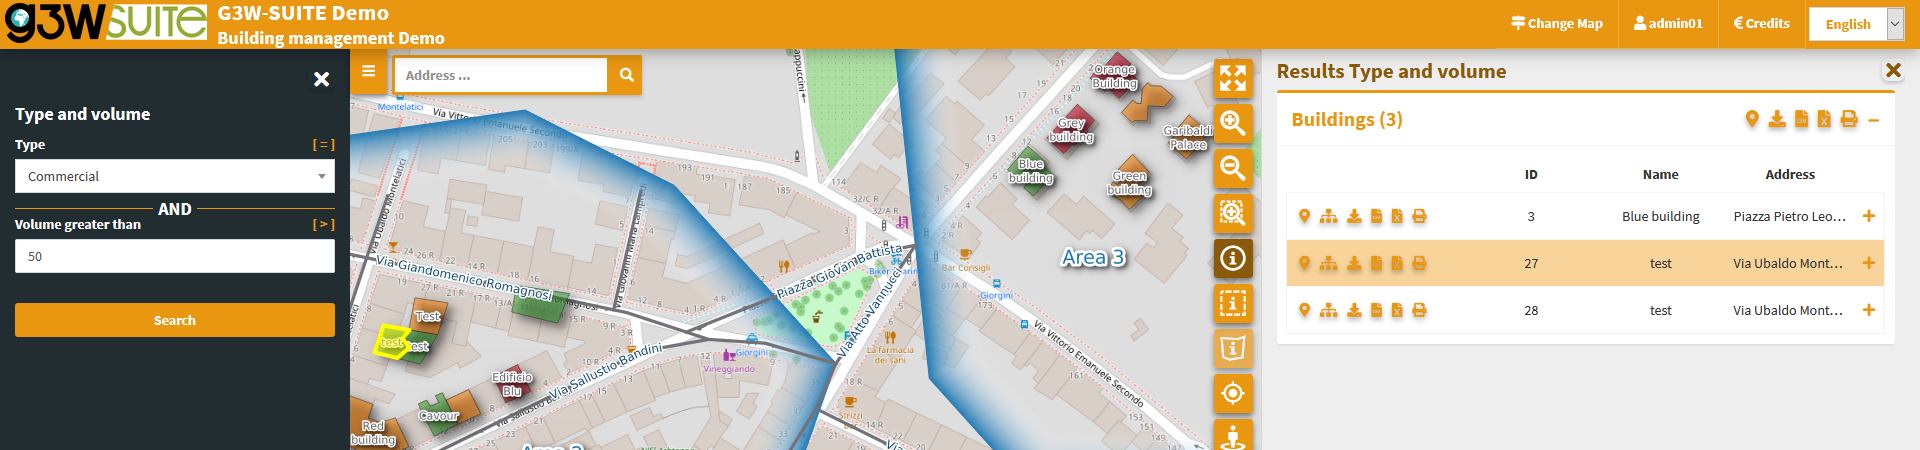
The Search menu contains the list of search tools defined through the Administration panel and custom searches created with the Query Builder.
Si sceglie la ricerca di interessa, si compilano i campi richiesti e si clicca sul tasto Cerca.
Sul lato destro del client si aprirà il pannello con la lista dei risultati, per ogni risultato saranno visualizzati i primi tre campi della tabella associata.
Posizionandosi sui singoli risultati, la features corrispondente verrà evidenziata in mappa; cliccando sui singoli risultati si potranno consultare tutti gli attributi associati alla feature.
Zoom to features and download icons are available for results (single or cumulative)
Mappa
This session has three tabs:
Strati: elenco strutturato degli strati, definito su progetto QGIS
Basi: scelta della mappa di base tra quelle definite a livello di creazione Gruppo Cartografico
Legend: graphic legend
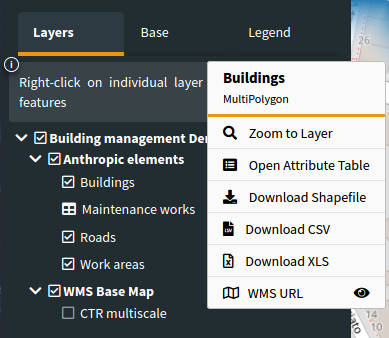
Layers
In the list of layers, right click on the name of the single layer shows the following items:
Name and kind of geometry of the layer
Metadata: descriptive information inherited from what has been defined, at QGIS project level, in the “Abstract” form of the “QGIS Server” session of the “Layer Properties”
Styles: to choose the style to be applied to the layer, in the case of multi-style layers
Abstract: a text (also html) defined in the Layer Properties, Metadata session, Identification tab, Abstract form.
Zoom to layer: per zoommare all”estensione del layer
Open attribute table: to consult the associated attribute table
Download shapefile: to download the layer as a shapefile; function activatable from the administration panel
Download GEOTIFF: to download a raster in GeoTiff format, full layer or clipped to the extent of the canvas; function activatable from the administration panel
Download GeoPackage: to download the layer as a GeoPackage; function activatable from the administration panel
Download CSV: to download the layer as a CSV; function activatable from the administration panel
Download XLS: to download the layer as a XLS; function activatable from the administration panel
WMS/WFS URL: URL of the WMS/WFS service relative to the project or URL of the external WMS
It is possible to hide, automatically, layers from the TOC when they have no records.
Useful when using filters on layers or geographic views.
Attribute table
The attribute table (resizable) is equipped with paging function, highligth function and zooming to the associated features.
In caso di presenza di link a contenuti multimediali, saranno visualizzabili le anteprime delle immagini e/o il tasto Apri per la consultazione di diversa tipologia di contenuto.
The window is resizable.
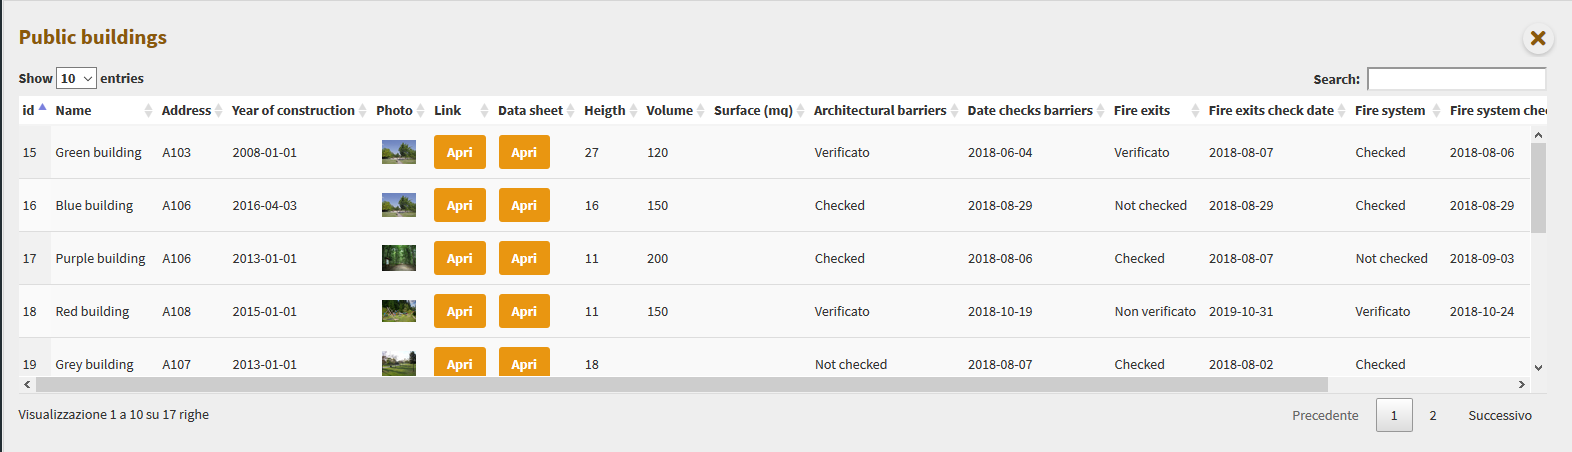
A generic filter, positioned at the top right, is applied generically to the contents of all the fields and it will allow you to filter the list of displayed records.
Filters based on the contents of the individual fields are available at the top of each column.
The Show features visible on the map icon  allows you to filter the records of the table according to the features visible in the map.
From this version it is possible to select the features of the individual layers and apply filters that will affect:
on the map content
on the attribute table content
on the contents of the plots
on print contents (only with QGIS 3.18)
The selection of features can be made:
at the attribute table level (through the checkboxes on the left of each records)
on the results of a query (add / remove from current selection)
on the results of a query (add / remove from current selection)
At the same time, additional icons appear:
on the layer attribute table
to the right of the layer on the TOC
at the level of the relevant plots
Aggiungi immagine: g3wclient_selection.png The icons in the attribute table allow you to:
 Clear selection
 Invert selection
 Add/Remove filter
The icons to the right of the layer on the TOC allow you to:
Clear selection
Add/Remove filter
![]()
When one or more features are selected, they appear highlighted in red on the map. Activation of the filter is reflected:
on the map content
on the attribute table content
on the data displayed by plots
on the print contents (only with QGIS 3.18)
Base layer
The list shows the active base layers at the cartographic group level.
If the user has created base layers starting from cached layers, these may also be present.
Legend
If at the publication level of the QGIS project, the Legend position option i setted as TOC, this panel will be not present and the legend will be rendered inside layers TOC.
If the option is activated on the QGIS project, the legend is filtered on the map content.
Time series
NB: the Time Series function is only available with a QGIS Server version >= 3.26
This version of G3W-SUITE manages the temporal aspects for both vector and raster layers but with limitations:
vector layers: limited to the Single field with Date/Time configuration
raster layers: only for NetCDF file upload as raster (no Mesh)
WMS-T
If in the QGIS project a temporal vector/raster layer on which the Dynamic temporal control property has been activated is present, the client will show an additional panel called Time series.
This panel will allow you to:
define the start/end date of the time series
define the step of the animation
start and manage the temporal animation

The modification of the start date of the series will determine the updating of the map with the visualization of the layer in coherence with the chosen date.
Pay attention: to use the Time series function for raster data, it must also be activated at the level of the G3W-ADMIN layer properties.
