G3W-CLIENT: the cartographic viewer
Generic aspects
The application has a responsive interface consisting of expandable and reducible sessions.
The color of the interface depends on the type of user logged in.
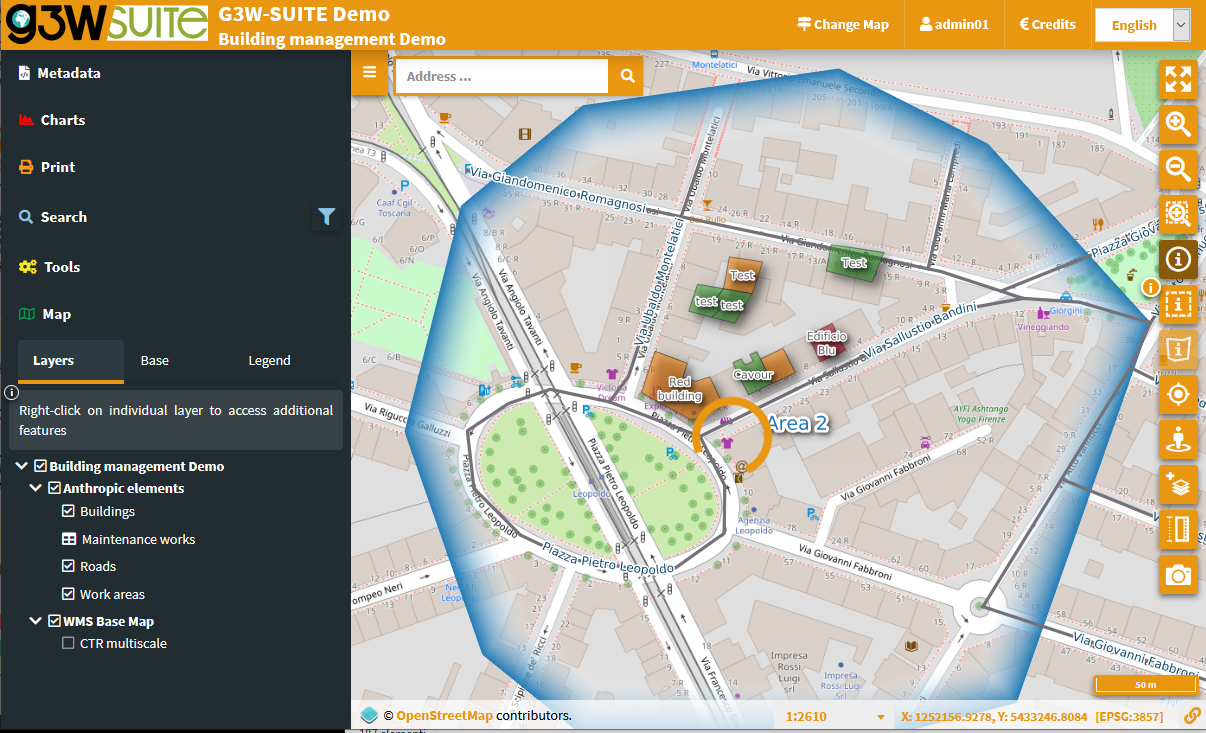
The header contains the following elements:
Logo, title and subtitle, deriving from:
main title (set at General Data level) or MacroGroup name, according to the settings
Cartographic Group name
WebGis service title
Change map: which allows you to switch from one WebGis service to another (located within the same Cartographic Group) while maintaining extension and display scale
User ID: if you have logged in to the system
Credits
Home: to access the FrontEnd
Language: the choice of language is reflected in the individual menus of the map client and on the contents of the access portal. The languages available are those activated by the Administration.

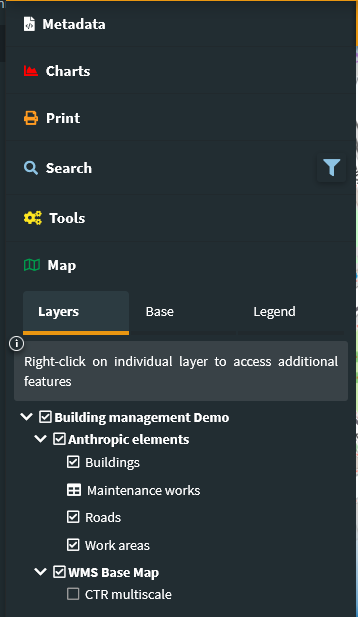
The Tools panel is located on the left and containing the following objects:
Metadata: content defined on QGIS project
Print: printing tool based on the layouts defined on the QGIS project
Search: with the search tools defined through the Administration panel
Tools: session that collects the various tools that may be activated on the WebGis service
Map: containing:
Layers: structured list of layers, defined on the QGIS project
Base: choice of the base map from those defined at the creation level of the Thematic Group
Legend: graphic legend of the various layers
The centrally located map area presents the various navigation and map interaction controls, this controls are defined at the Cartographic Group level.
Navigation and interaction with the map
Map area
At the base of the map area there is an information bar showing:
display scale
mouse coordinates
project projection system
icon to copy the URL with the references to the extension currently displayed

Map controls
The icons and description of the functions of the various MapControls activated at the thematic group level are shown below.

zoomtoextent: zoom to the initial extension
zoom: zoom in and zoom out
zoombox: zoom tool based on drawing a rectangle
query: puntual query of geographical layers
querybbox: query via bounding box - N.B. for the layers to be queried according to this method it is necessary that they are published as WFS services on the QGIS project
querybypolygon: it will be possible to automatically query the features of one or more layers that fall within a polygonal element of a guide layer. (Eg what’s inside a cadastral parcel?). - N.B. the questionable layers must be published as WFS services on the QGIS project
geolocation: geolocation tool (useful for consultation from tablet)
nominatin: search tools for addresses and toponyms based on OSM
streetview: Google StreetView on your map
length: linear measuring instrument
area: tool for measuring surfaces
addlayers: tool for temporarily uploading GeoJson ,KML and SHP (zipped) vector layers to WebGis
snapshot: tool for taking snapshots of the map area
It should be noted that the query function acts, by default, with the coring method, providing information relating to all the layers underlying the point where you click with the mouse or draw a box.
To query a single layer, it must be previously selected at the TOC level.
Remember that query modes based on querybbox and querybypolygon require the publication of all the layers involved as WFS services at the QGIS project level.
NB: Remember that, after viewing the results, it will be possible to zoom on the feature associated with the individual results only if the option Add geometry to object response has been activated at the QGIS project level (Project → Properties, QGIS Server session).
Attributes form
In the QGIS project (Vector properties → Attributes Form), you can create custom attribute forms (tabs, groups …)
The same structured form will be reported at the query level on the cartographic client.
The window is resizable.
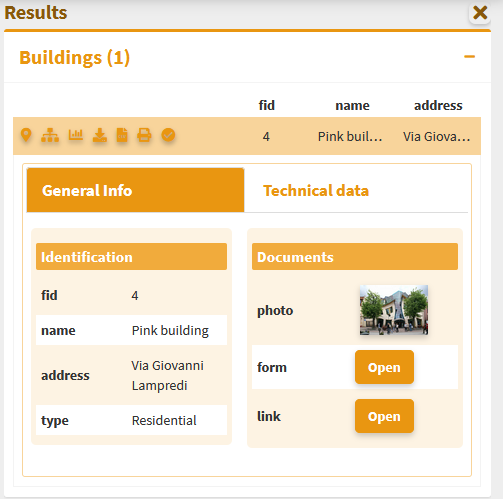
Any links to photos will determine the display of a clickable preview, any links to links or other multimedia content will determine the display of the Open button that will allow consultation of the link.
For further information on this point, see the dedicated paragraph.
The orange bar above the query results shows the following icons:
![]()
Zoom to features: if the function is activated on the Properties of the QGIS project
Show relations (1: N): if present on the QGIS project
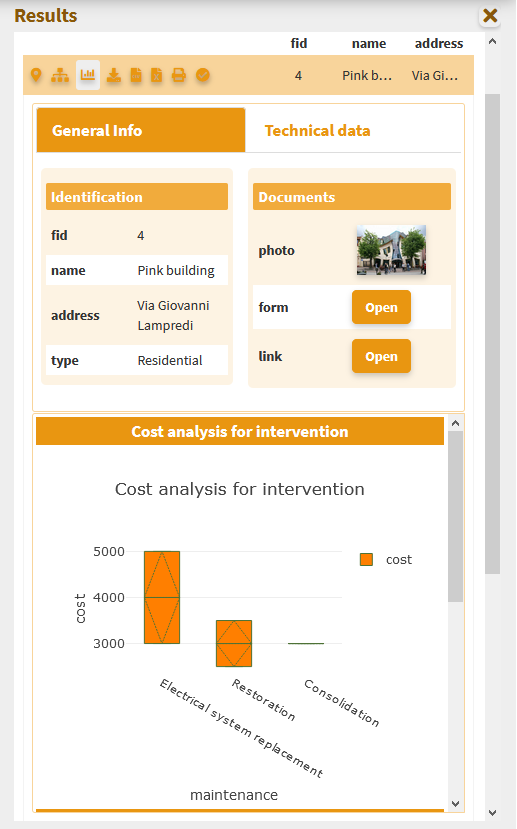
Show relation charts: display of plots related to 1: N related data. Only if 1: N relationships are associated with the interrogated layer and plots have been activated on the referencing tables.
Download Shapefile, GPK, GPX, CSV, XLS: if activated in the administration session
Print Atlas: prints the atlas sheet (if set on QGIS project) related to the queried feature
Add/Remove selection: add/remove the features to the current selection
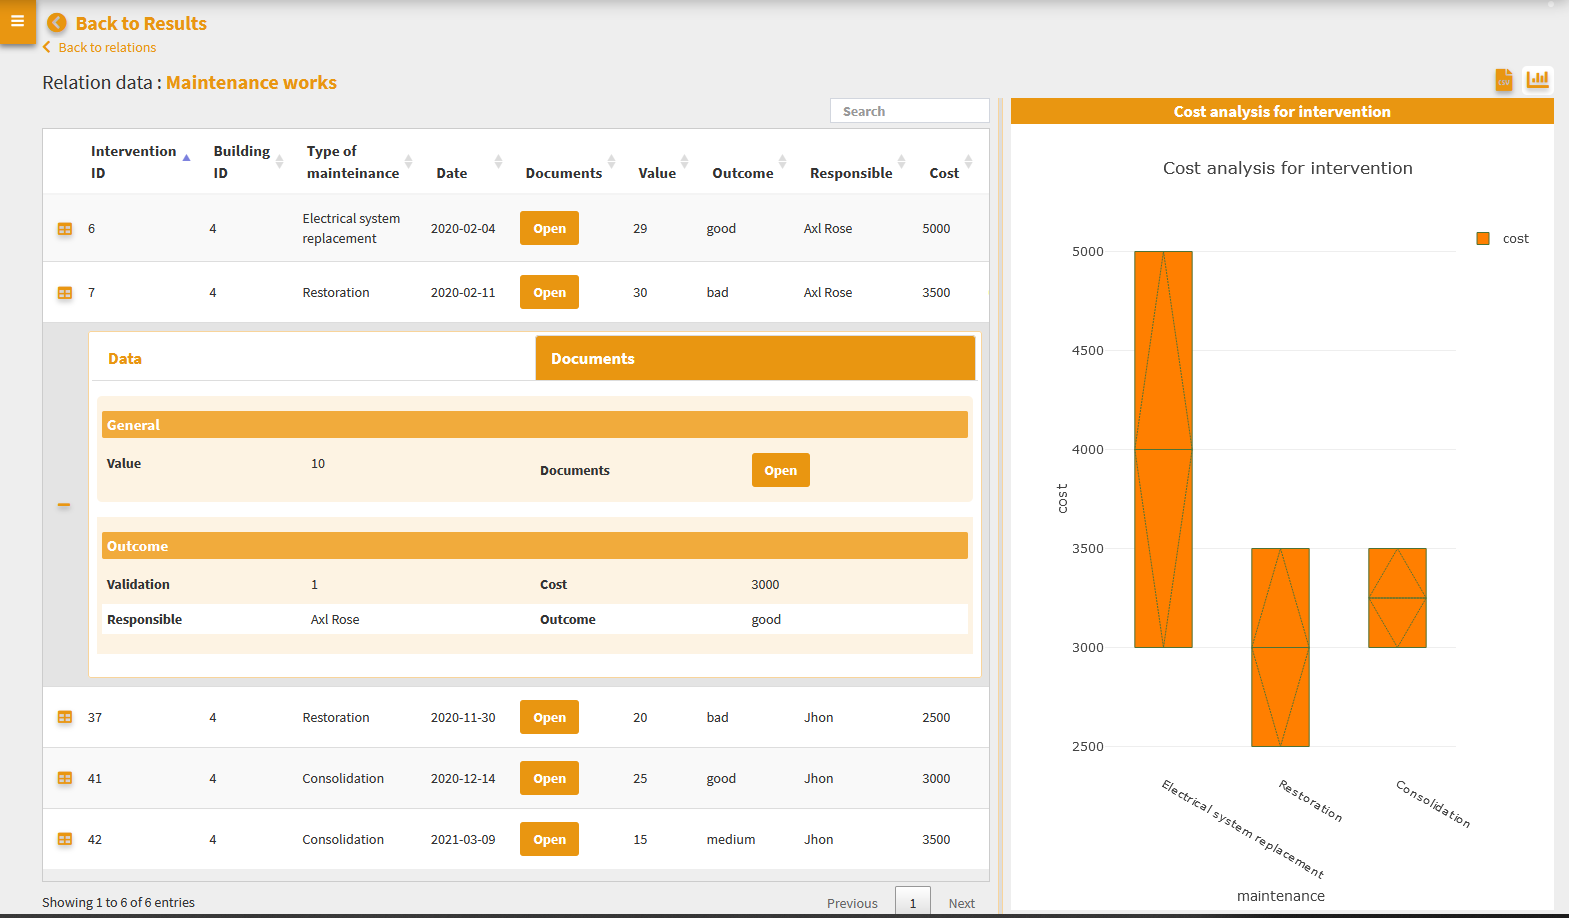
Display of 1:n relation data
In the event that, at the QGIS project level, one or more type 1:n relations have been associated with a layer, the icon View Relationships will be shown in the attribute form.
By clicking on the icon you will access the list of 1:N relations present and, from these, the list of child records associated with the individual relationships.
In the case of a simple 1:1 or N:1 joins, the joined records will be displayed directly in the main form.
In the new frame, a filter, applied generically to the contents of all fields, will allow you to filter the list of child records.
The icon to the left of each record allows you to switch from the classic table view to the one based on any form defined on the QGIS project
In the case of links to multimedia contents, the previews of the images and/or the Open button will be displayed for consultation of different types of content.
In case of active plots on the related table, these will be displayed through Show charts at the top right.
Tools panel
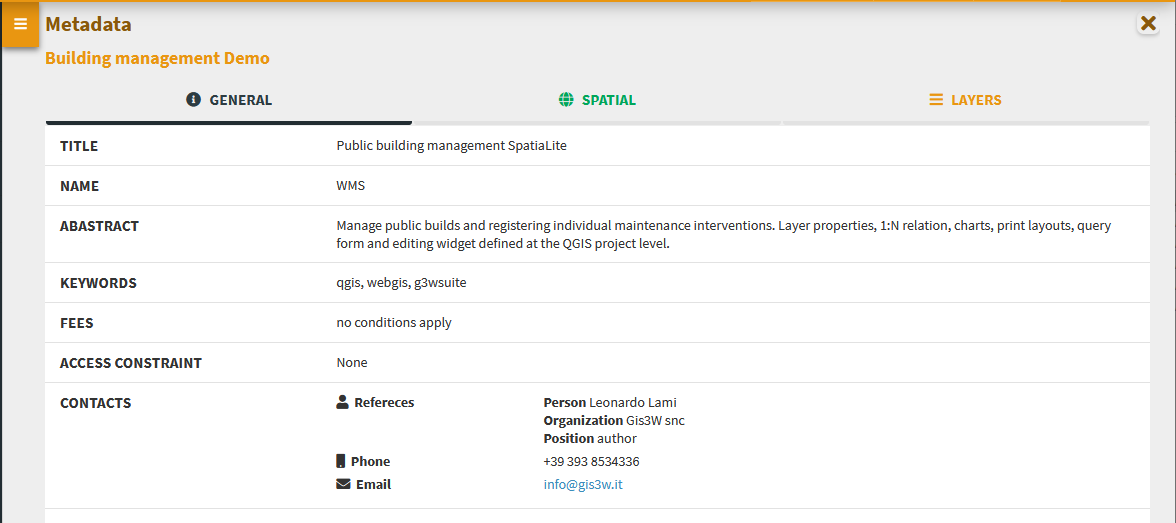
Metadata
The metadata reported in this session derive from those set at the QGIS project level.
This content is divided into three sessions: General, Space Info and Layers.
General: reports the metadata defined on the QGIS project in the item:Project → Properties (QGIS Server session, Service Capabilities)In case of login as anonymous user the URL of the WMS service is shown.Spatial: reports the EPSG code of the projection system associated with the QGIS project and the BoundingBox relating to the initial publication extension, defined in the item:Project → Properties (QGIS Server session, WMS Capabilities, Advertised extent)Layers: reports simple metadata associated with the individual layers.
Charts
View graphs created using QGIS DataPlotly and activated at the admin session level.
Check the plots in the list and consult them on the rigth panel.
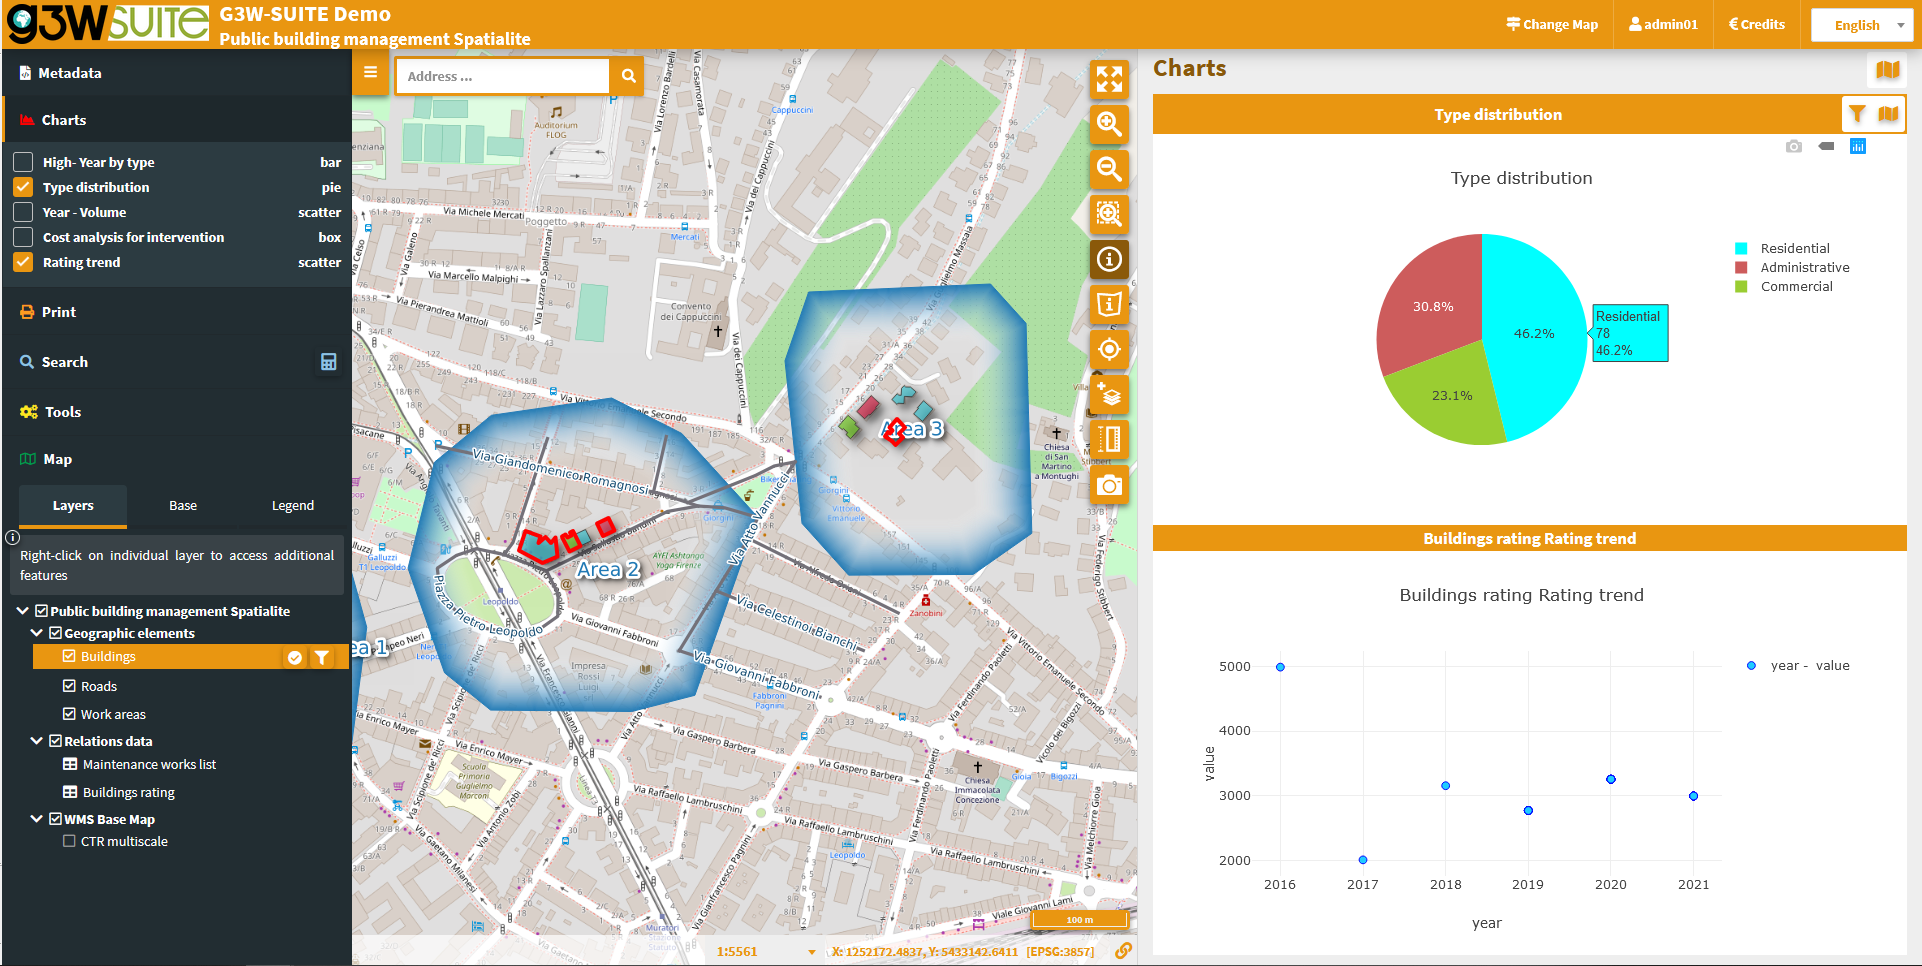
The graphs are filterable based on the:
 features visible on the map
 filter based on the selected features
These filters are also reflected on the plots associated to the related data (in 1:N mode) based on the visible and/or selected parent features.
The filter based on the map content can be activated globally on all plots (icon at the top of the panel dedicated to charts) or on only some specific plots (icon placed at the level of the individual plots).
The plots will automatically update after pan and zoom operations on the map
If activated, the filter based on the selected features is automatically activated on all related plots (associated with the same layer and with the 1:N relationed tables)
Appropriate messages at the single plots level will indicate the activation of these filters.
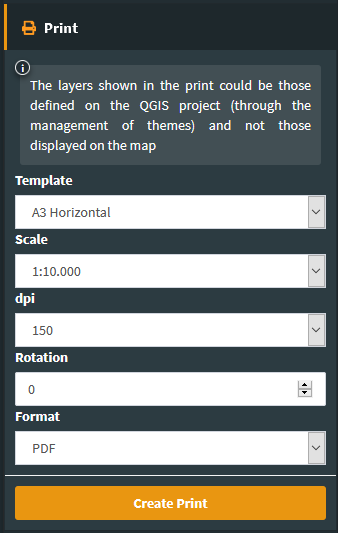
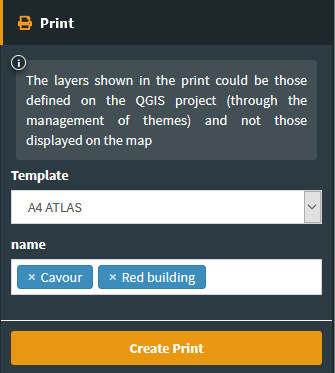
Print
Printing tool based on layouts defined on QGIS project.
The tool allows you to choose:
Template: print layout among those associated with the published QGIS project
Scale: print scale
DPI: print resolution
Rotation: rotation angle
Format: print to PDF or JPEG
On the map, a lit rectangular area will allow you to define the print area.
If an Atlas type print layout is associated in the QGIS project, the layout reference will be available. The cards to be printed are defined by referring to the atlas identifier defined in the print layout.
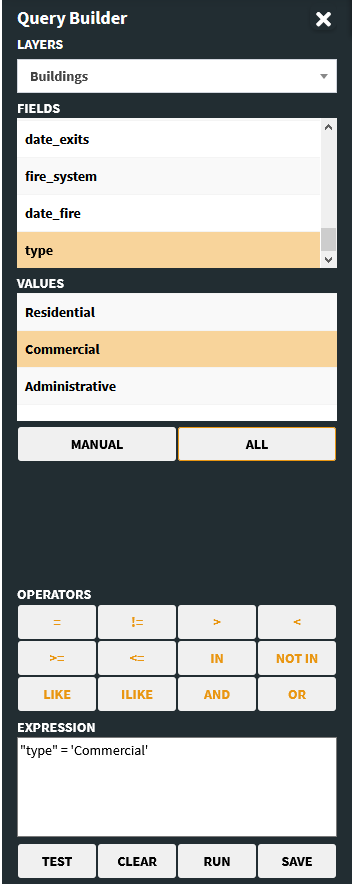
Search and Query Builder
A classic Query Builder is present at the Search menu level. Through this tool it is possible to:
carry out alphanumeric searches on geometric layers
save the query to reuse it until the end of the work session
edit a previously saved query
The saved query will be available until the browser cache is cleared
The Search menu contains the list of search tools defined through the Administration panel and custom searches created with the Query Builder.
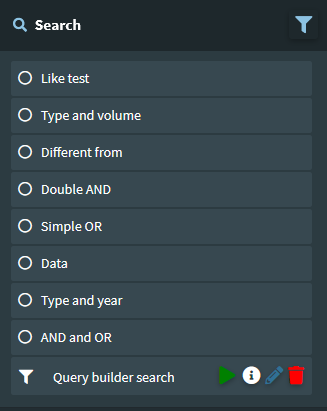
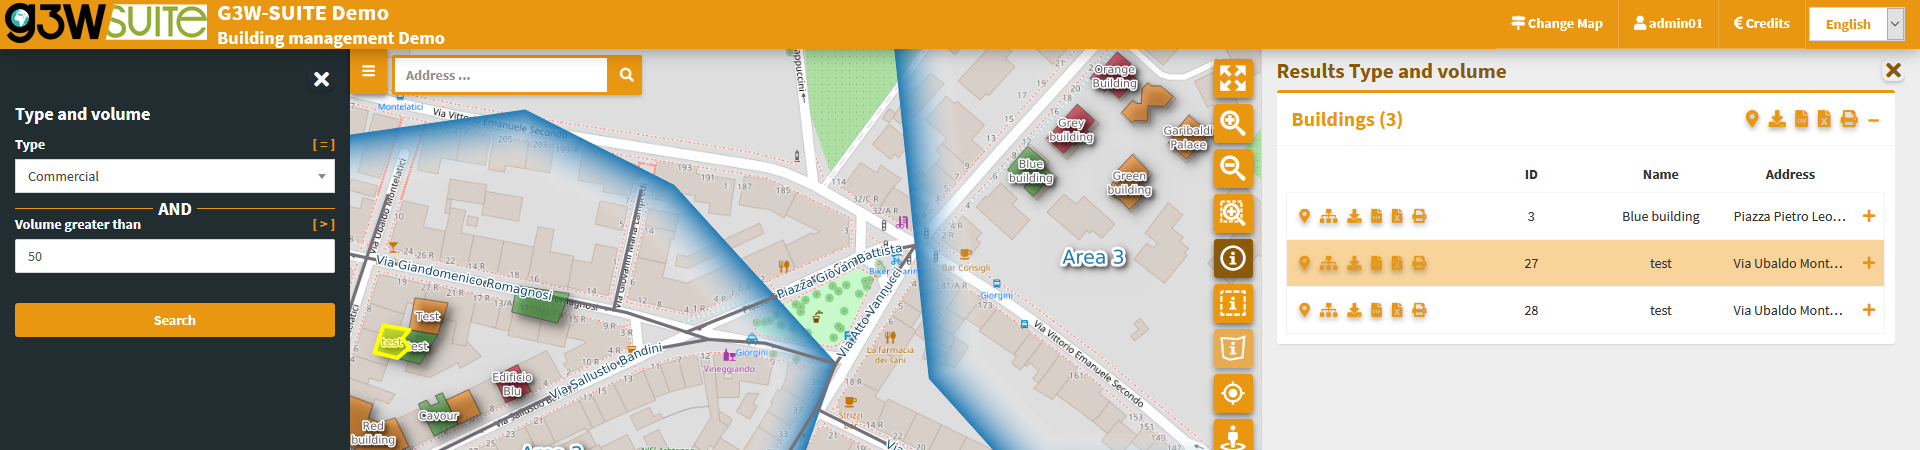
You choose the search you are interested in, fill in the required fields and click on the Search button.
The panel with the list of results will open on the right side of the client, for each result the first three fields of the associated table will be displayed.
By positioning on the individual results, the corresponding features will be highlighted on the map; clicking on the individual results you can consult all the attributes.
Zoom to features and download icons are available for results (single or cumulative)
Map
This session has three tabs:
Layers: structured list of layers, defined on the QGIS project
Base: choice of the base map from those defined at the Cartographic Group creation level
Legend: graphic legend
Layers
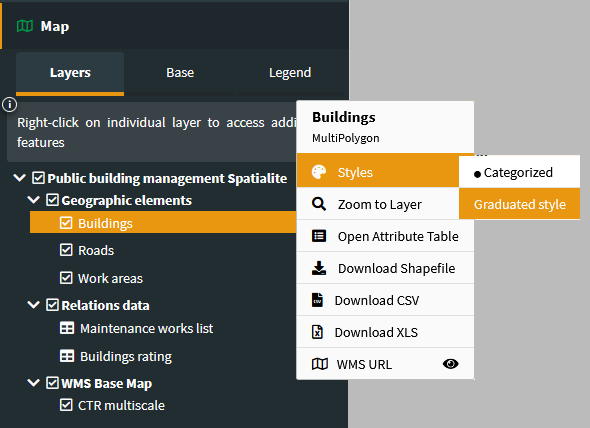
In the list of layers, right click on the name of the single layer shows the following items:
Styles: to choose the style to be applied to the layer, in the case of multi-style layers
Name and kind of geometry of the layer
Zoom to layer: to zoom in on the extension of the layer
Open attribute table: to consult the associated attribute table
Download shapefile: to download the layer as a shapefile; function activable from the administration panel
Download GeoPackage: to download the layer as a GeoPackage; function activable from the administration panel
Download CSV: to download the layer as a CSV; function activable from the administration panel
Download XLS: to download the layer as a XLS; function activable from the administration panel
WMS URL: URL of the WMS service relative to the project or URL of the external WMS
Attribute table
The attribute table (resizable) is equipped with paging function, highligth function and zooming to the associated features.
In the case of links to multimedia content, the previews of the images and/or the Open button will be displayed for consultation of different types of content.
The window is resizable.
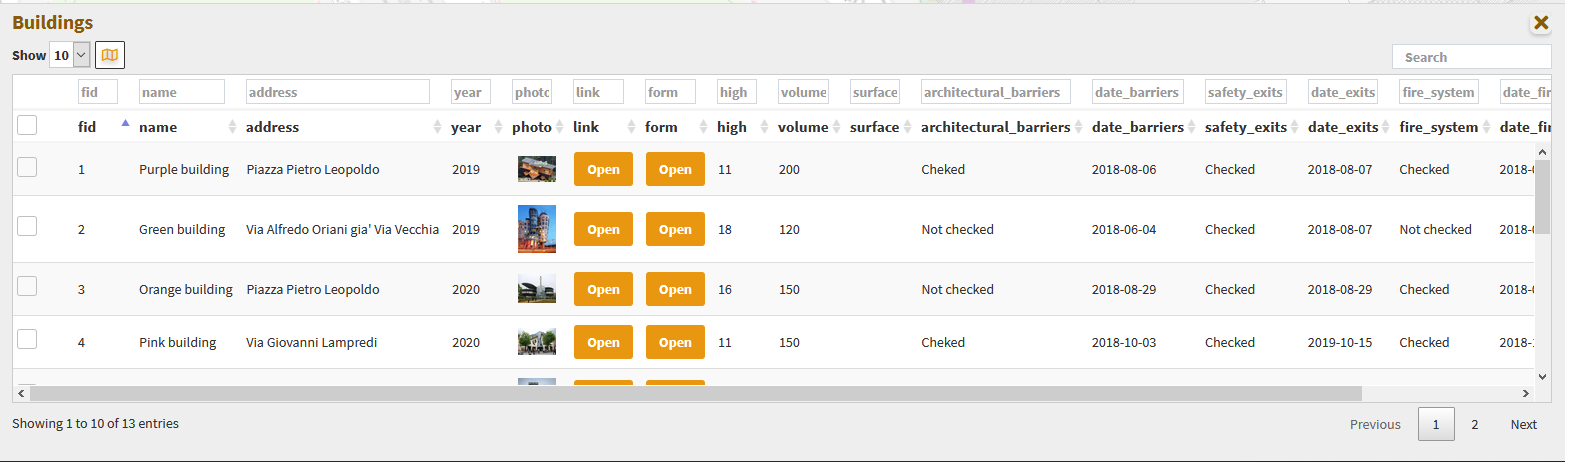
A generic filter, positioned at the top right, is applied generically to the contents of all the fields and it will allow you to filter the list of displayed records.
Filters based on the contents of the individual fields are available at the top of each column.
The Show features visible on the map icon  allows you to filter the records of the table according to the features visible in the map.
From this version it is possible to select the features of the individual layers and apply filters that will affect:
on the map content
on the attribute table content
on the contents of the plots
on print contents (only with QGIS 3.18)
The selection of features can be made:
at the attribute table level (through the checkboxes on the left of each records)
on the results of a query (add / remove from current selection)
on the results of a query (add / remove from current selection)
At the same time, additional icons appear:
on the layer attribute table
to the right of the layer on the TOC
at the level of the relevant plots
Aggiungi immagine: g3wclient_selection.png The icons in the attribute table allow you to:
 Clear selection
 Invert selection
 Add/Remove filter
The icons to the right of the layer on the TOC allow you to:
Clear selection
Add/Remove filter
![]()
When one or more features are selected, they appear highlighted in red on the map. Activation of the filter is reflected:
on the map content
on the attribute table content
on the data displayed by plots
on the print contents (only with QGIS 3.18)
Base layer
The list shows the active base layers at the cartographic group level.
If the user has created base layers starting from cached layers, these may also be present.
Legend
if the option is activated on the QGIS project, the legend is filtered on the map content.